Introduction #
The authors of the Insulator-Defect Detection dataset highlight the significant challenge faced by existing detection methods when identifying insulators with minor defects in transmission line images with complex backgrounds.
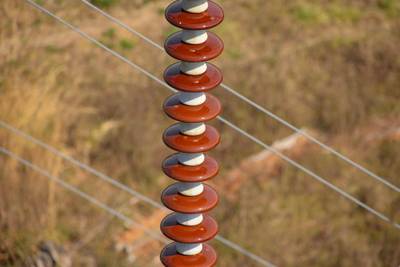
Insulators play a crucial role as electrical equipment in overhead transmission lines, providing electrical insulation and mechanical fixation. Over time, insulators are prone to various defects, including self-explosion, damage, pollution flashover, and current leakage, due to exposure to strong electric fields and harsh environments.
Among the common faults, insulator damage and surface defects caused by pollution flashovers are prevalent. Pollution flashovers occur when pollutants accumulate on the insulation surface, creating a conductive film that reduces insulation strength and increases leakage current, leading to partial discharge. Insulator defects contribute to more than half of power grid system failures, making rapid detection and identification of insulators and their defects valuable for maintenance and repair personnel.
Traditional insulator-defect detection methods involve helicopter-manned or field inspections, or the use of traditional detection algorithms on images captured by robots or drones. However, the complexity of China’s transmission line structure makes these methods inefficient and resource-intensive. Uncrewed aerial vehicles capture images with a large field of view, posing challenges in targeting insulator defects due to the complex background environment and small defect targets, which can hinder defect detection. Thus, there is an urgent need to propose a small-target fault detection method for transmission lines with complex backgrounds to enhance detection efficiency.
In the field of electric power, there are limited published insulator-defect datasets, particularly for overhead transmission lines. The dataset created by the authors consists of 1600 original images collected from sources like Baidu, Google, and public datasets. The images have high-resolution with width and height values ranging from 2000 to 5000 and 2000 to 3000 pixels, respectively. The insulator dataset was constructed based on the original pictures and includes two main defects: pollution flashover and damage.
Summary #
Insulator-Defect Detection is a dataset for an object detection task. It is used in the energy industry.
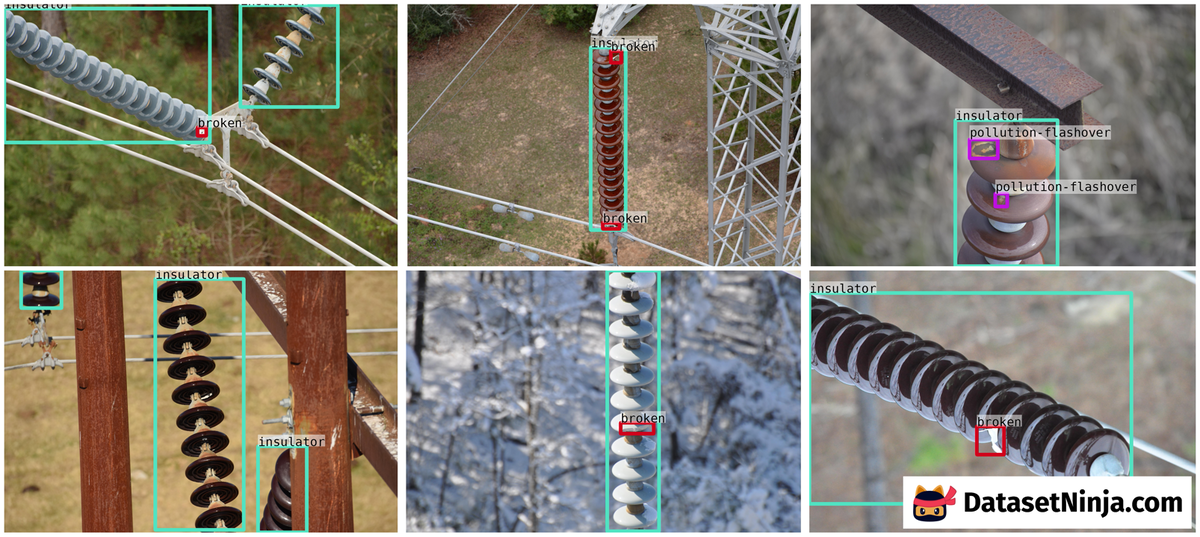
The dataset consists of 1600 images with 5373 labeled objects belonging to 3 different classes including insulator, pollution-flashover, and broken.
Images in the Insulator-Defect Detection dataset have bounding box annotations. All images are labeled (i.e. with annotations). There are 3 splits in the dataset: train (1296 images), test (160 images), and val (144 images). The dataset was released in 2022 by the Changzhou University and Chinese Academy of Sciences.
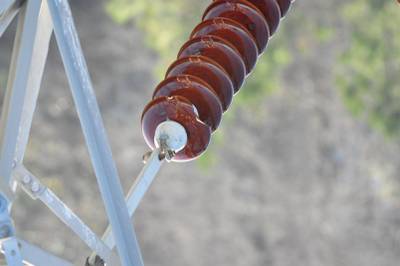
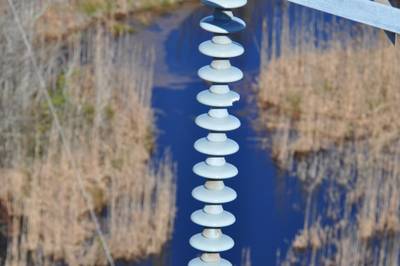
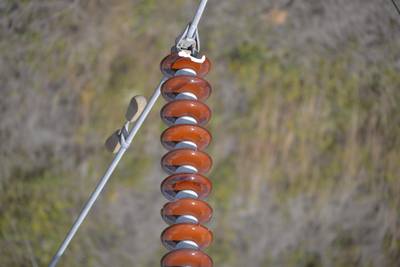
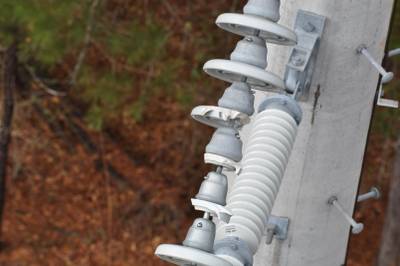
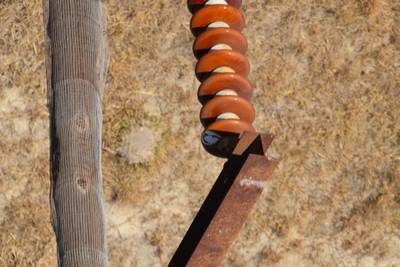
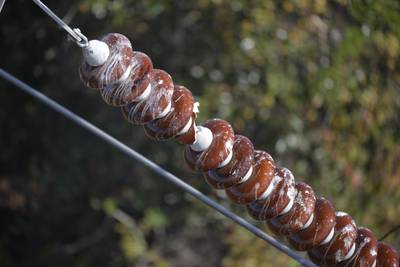
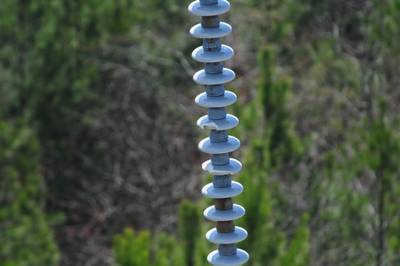
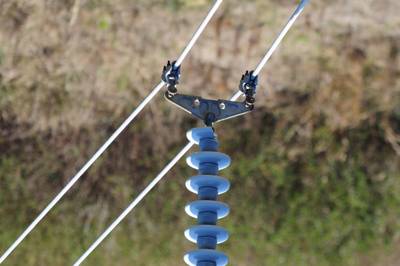
Here is the visualized example grid with annotations:
Explore #
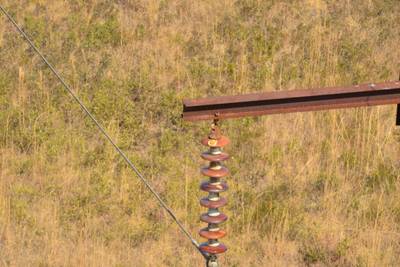
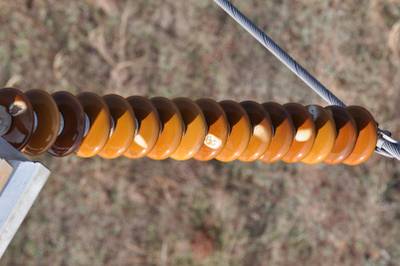
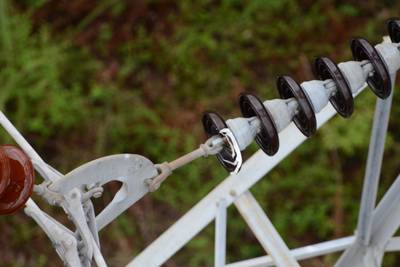
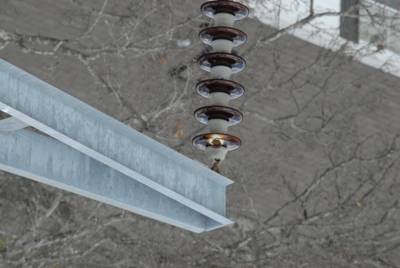
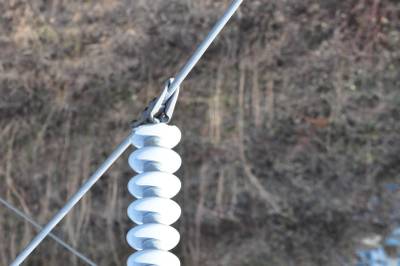
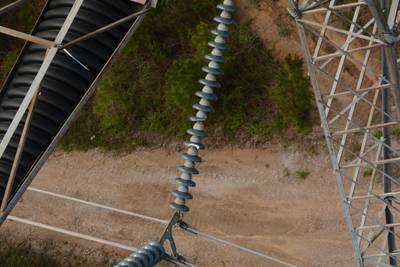
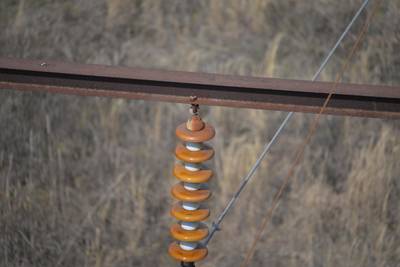
Insulator-Defect Detection dataset has 1600 images. Click on one of the examples below or open "Explore" tool anytime you need to view dataset images with annotations. This tool has extended visualization capabilities like zoom, translation, objects table, custom filters and more. Hover the mouse over the images to hide or show annotations.












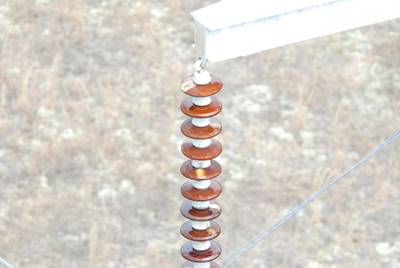


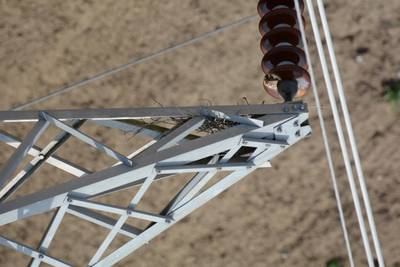

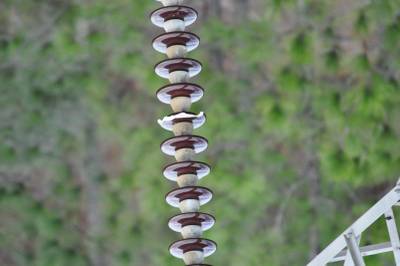

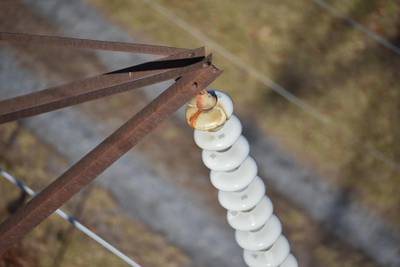

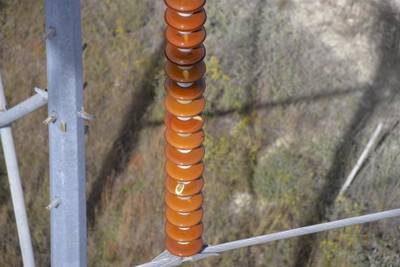

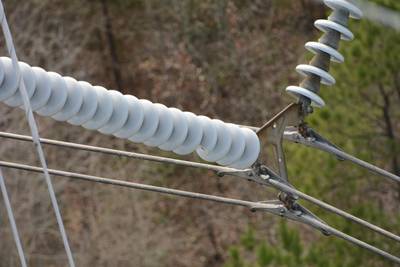

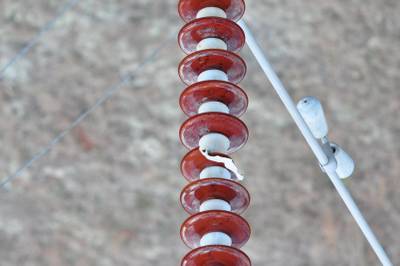

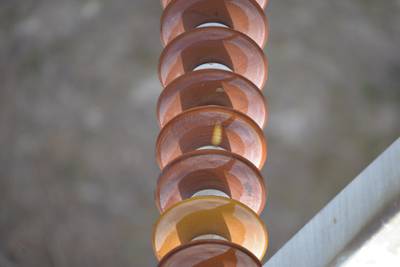












Class balance #
There are 3 annotation classes in the dataset. Find the general statistics and balances for every class in the table below. Click any row to preview images that have labels of the selected class. Sort by column to find the most rare or prevalent classes.
Class ㅤ | Images ㅤ | Objects ㅤ | Count on image average | Area on image average |
|---|---|---|---|---|
insulator➔ rectangle | 1600 | 1832 | 1.15 | 21.2% |
pollution-flashover➔ rectangle | 806 | 2448 | 3.04 | 0.66% |
broken➔ rectangle | 785 | 1093 | 1.39 | 0.82% |
Co-occurrence matrix #
Co-occurrence matrix is an extremely valuable tool that shows you the images for every pair of classes: how many images have objects of both classes at the same time. If you click any cell, you will see those images. We added the tooltip with an explanation for every cell for your convenience, just hover the mouse over a cell to preview the description.
Images #
Explore every single image in the dataset with respect to the number of annotations of each class it has. Click a row to preview selected image. Sort by any column to find anomalies and edge cases. Use horizontal scroll if the table has many columns for a large number of classes in the dataset.
Object distribution #
Interactive heatmap chart for every class with object distribution shows how many images are in the dataset with a certain number of objects of a specific class. Users can click cell and see the list of all corresponding images.
Class sizes #
The table below gives various size properties of objects for every class. Click a row to see the image with annotations of the selected class. Sort columns to find classes with the smallest or largest objects or understand the size differences between classes.
Class | Object count | Avg area | Max area | Min area | Min height | Min height | Max height | Max height | Avg height | Avg height | Min width | Min width | Max width | Max width |
|---|---|---|---|---|---|---|---|---|---|---|---|---|---|---|
pollution-flashover rectangle | 2448 | 0.22% | 3.25% | 0.01% | 29px | 0.78% | 1084px | 22.07% | 148px | 4.83% | 26px | 0.67% | 751px | 19.75% |
insulator rectangle | 1832 | 18.58% | 99.45% | 0.46% | 166px | 4.51% | 3993px | 100% | 1920px | 66.06% | 189px | 4.9% | 7078px | 99.97% |
broken rectangle | 1093 | 0.59% | 3.36% | 0.03% | 45px | 1.71% | 893px | 28.37% | 225px | 7.95% | 34px | 0.92% | 926px | 36.99% |
Spatial Heatmap #
The heatmaps below give the spatial distributions of all objects for every class. These visualizations provide insights into the most probable and rare object locations on the image. It helps analyze objects' placements in a dataset.

Objects #
Table contains all 5373 objects. Click a row to preview an image with annotations, and use search or pagination to navigate. Sort columns to find outliers in the dataset.
Object ID ㅤ | Class ㅤ | Image name click row to open | Image size height x width | Height ㅤ | Height ㅤ | Width ㅤ | Width ㅤ | Area ㅤ |
|---|---|---|---|---|---|---|---|---|
1➔ | insulator rectangle | 15067999d.jpg | 4000 x 6000 | 2433px | 60.83% | 1964px | 32.73% | 19.91% |
2➔ | pollution-flashover rectangle | 15067999d.jpg | 4000 x 6000 | 323px | 8.07% | 505px | 8.42% | 0.68% |
3➔ | insulator rectangle | 15060399.jpg | 4000 x 6000 | 2203px | 55.08% | 1134px | 18.9% | 10.41% |
4➔ | broken rectangle | 15060399.jpg | 4000 x 6000 | 210px | 5.25% | 823px | 13.72% | 0.72% |
5➔ | insulator rectangle | 130047v.jpg | 2000 x 3008 | 1987px | 99.35% | 1767px | 58.74% | 58.36% |
6➔ | broken rectangle | 130047v.jpg | 2000 x 3008 | 299px | 14.95% | 373px | 12.4% | 1.85% |
7➔ | insulator rectangle | 000000986d.jpg | 1424 x 2144 | 1005px | 70.58% | 561px | 26.17% | 18.47% |
8➔ | broken rectangle | 000000986d.jpg | 1424 x 2144 | 130px | 9.13% | 194px | 9.05% | 0.83% |
9➔ | insulator rectangle | 151397d.jpg | 2592 x 3872 | 1550px | 59.8% | 2090px | 53.98% | 32.28% |
10➔ | broken rectangle | 151397d.jpg | 2592 x 3872 | 175px | 6.75% | 93px | 2.4% | 0.16% |
License #
Citation #
If you make use of the Insulator-Defect Detection data, please cite the following reference:
@Article{s22228801,
    AUTHOR = {Zheng, Jianfeng and Wu, Hang and Zhang, Han and Wang, Zhaoqi and Xu, Weiyue},
    TITLE = {Insulator-Defect Detection Algorithm Based on Improved YOLOv7},
    JOURNAL = {Sensors},
    VOLUME = {22},
    YEAR = {2022},
    NUMBER = {22},
    ARTICLE-NUMBER = {8801},
    URL = {https://www.mdpi.com/1424-8220/22/22/8801},
    PubMedID = {36433397},
    ISSN = {1424-8220},
    ABSTRACT = {Existing detection methods face a huge challenge in identifying insulators with minor defects when targeting transmission line images with complex backgrounds. To ensure the safe operation of transmission lines, an improved YOLOv7 model is proposed to improve detection results. Firstly, the target boxes of the insulator dataset are clustered based on K-means++ to generate more suitable anchor boxes for detecting insulator-defect targets. Secondly, the Coordinate Attention (CoordAtt) module and HorBlock module are added to the network. Then, in the channel and spatial domains, the network can enhance the effective features of the feature-extraction process and weaken the ineffective features. Finally, the SCYLLA-IoU (SIoU) and focal loss functions are used to accelerate the convergence of the model and solve the imbalance of positive and negative samples. Furthermore, to optimize the overall performance of the model, the method of non-maximum suppression (NMS) is improved to reduce accidental deletion and false detection of defect targets. The experimental results show that the mean average precision of our model is 93.8%, higher than the Faster R-CNN model, the YOLOv7 model, and YOLOv5s model by 7.6%, 3.7%, and 4%, respectively. The proposed YOLOv7 model can effectively realize the accurate detection of small objects in complex backgrounds.},
    DOI = {10.3390/s22228801}
}
If you are happy with Dataset Ninja and use provided visualizations and tools in your work, please cite us:
@misc{ visualization-tools-for-insulator-defect-detection-dataset,
  title = { Visualization Tools for Insulator-Defect Detection Dataset },
  type = { Computer Vision Tools },
  author = { Dataset Ninja },
  howpublished = { \url{ https://datasetninja.com/insulator-defect-detection } },
  url = { https://datasetninja.com/insulator-defect-detection },
  journal = { Dataset Ninja },
  publisher = { Dataset Ninja },
  year = { 2026 },
  month = { jan },
  note = { visited on 2026-01-17 },
}
Download #
Dataset Insulator-Defect Detection can be downloaded in Supervisely format:
As an alternative, it can be downloaded with dataset-tools package:
pip install --upgrade dataset-tools
… using following python code:
import dataset_tools as dtools

dtools.download(dataset='Insulator-Defect Detection', dst_dir='~/dataset-ninja/')
Make sure not to overlook the python code example available on the Supervisely Developer Portal. It will give you a clear idea of how to effortlessly work with the downloaded dataset.
The data in original format can be downloaded here.
Disclaimer #
Our gal from the legal dep told us we need to post this:
Dataset Ninja provides visualizations and statistics for some datasets that can be found online and can be downloaded by general audience. Dataset Ninja is not a dataset hosting platform and can only be used for informational purposes. The platform does not claim any rights for the original content, including images, videos, annotations and descriptions. Joint publishing is prohibited.
You take full responsibility when you use datasets presented at Dataset Ninja, as well as other information, including visualizations and statistics we provide. You are in charge of compliance with any dataset license and all other permissions. You are required to navigate datasets homepage and make sure that you can use it. In case of any questions, get in touch with us at hello@datasetninja.com.


