

Introduction #
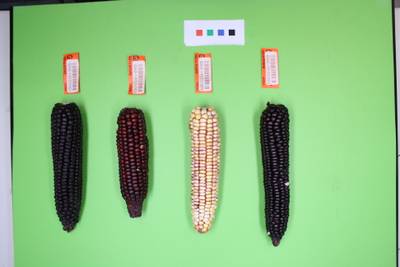
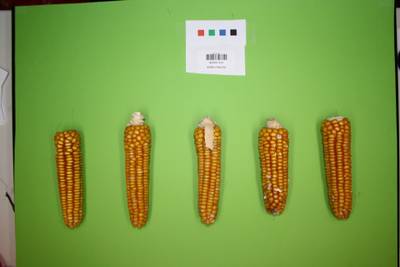
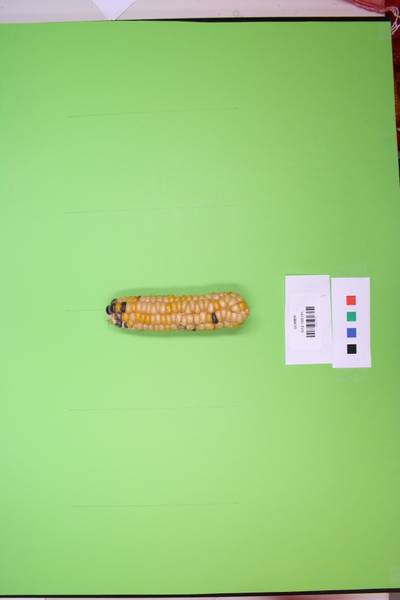
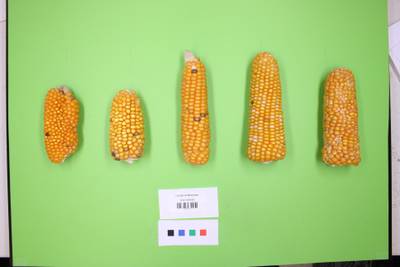
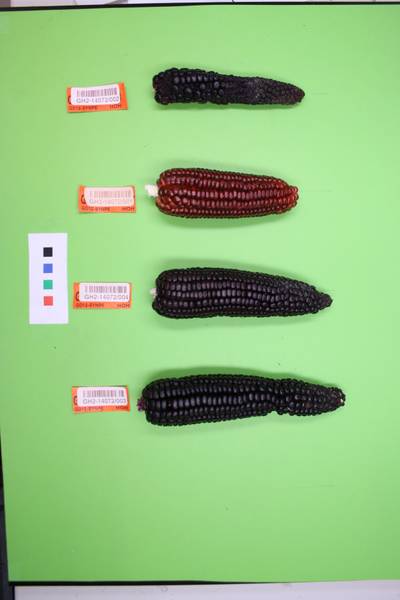
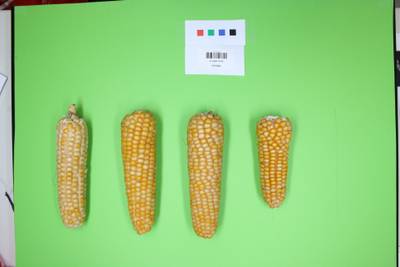
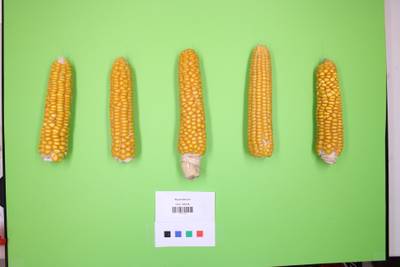
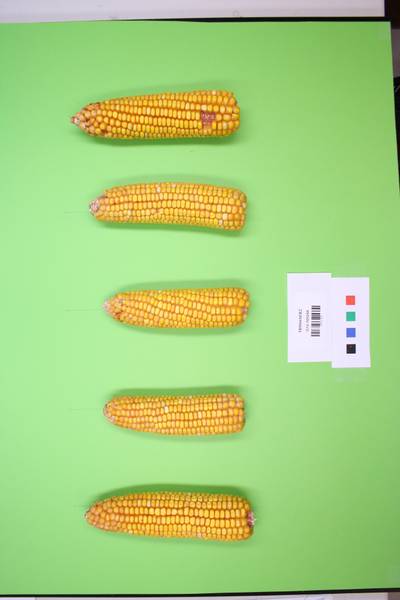
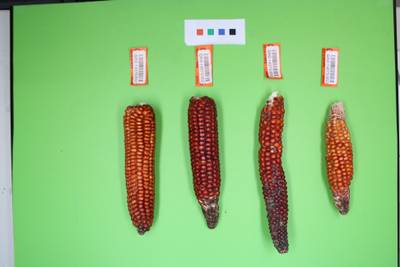
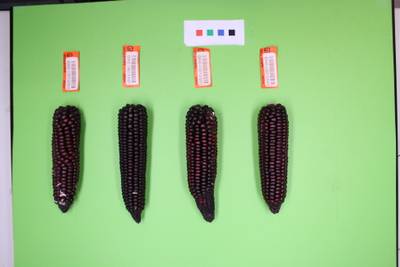
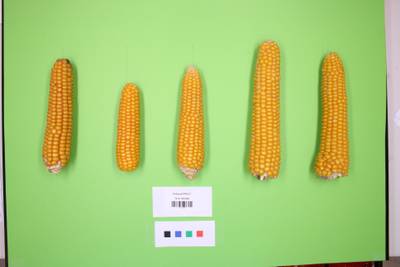
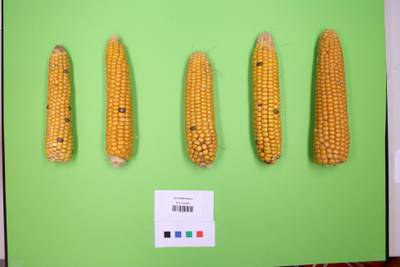
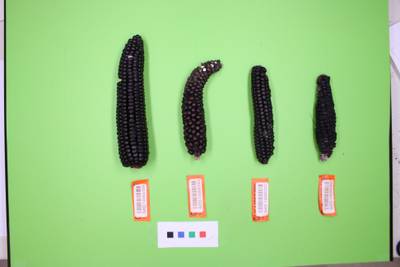
The authors created Maize Cobs: A Dataset for DeepCob Analysis to facilitate the study of maize cob image segmentation and phenotyping using classical image segmentation and deep learning methods. The dataset comprises a large collection of native maize landrace diversity images from Peru, exhibiting variations in the size, shape, and color of maize cobs.
High-throughput precision phenotyping is gaining importance in plant research, breeding, and crop production. However, phenotyping certain traits remains labor-intensive or technically challenging, posing a bottleneck in plant breeding and limiting progress in understanding genotype-phenotype relationships. To address this, phenomics platforms integrating high-throughput automated phenotyping and analysis software have been developed. Automated analysis of phenotypic data from these platforms is crucial to derive meaningful information for biological quantification.
Maize cobs are essential components of crop yield, with their size and shape significantly influencing total yield. They are potentially valuable traits for selection in breeding programs and for characterizing native diversity of crop plants to aid conservation and utilize them as genetic resources. The diversity of maize landraces, originating from South-Central Mexico around 9,000 years ago, offers a unique pool of genetic and phenotypic variation threatened by genetic erosion. Understanding this variation is crucial for identifying valuable genetic resources and developing targeted conservation strategies.
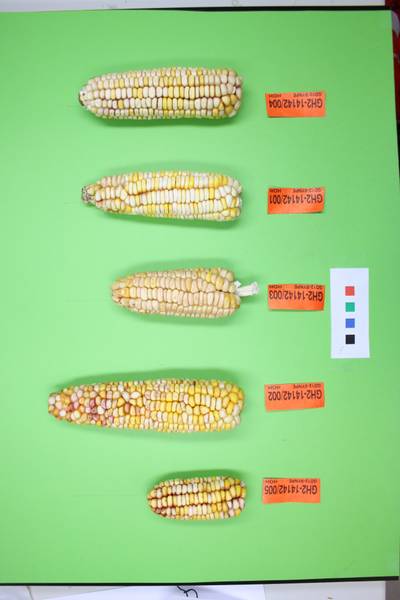
The dataset used in the study consists of 2,484 genebank accessions of 24 Peruvian maize landraces, representing diverse eco-geographical environments. The accessions were photographed during their genebank registration, resulting in 1,830 original (ImgOld) and 1,619 new (ImgNew) images, totaling 3,449 images. To achieve maximum diversity in image properties, subsets of training image data (200 or 1,000 images) were randomly selected from the ImgOld and ImgNew datasets consequently and divided into training and validation sets.
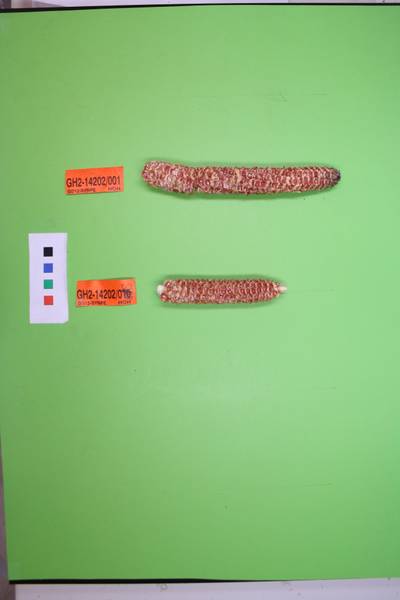
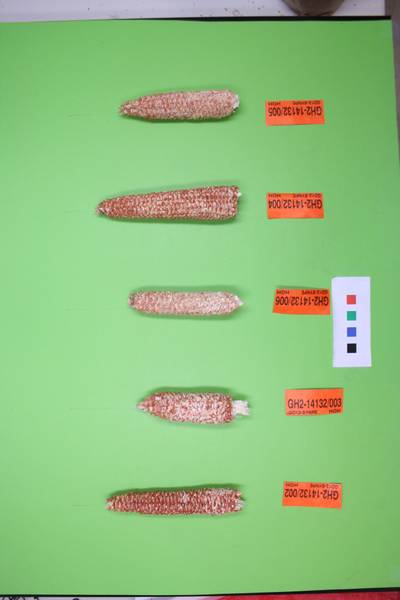
For updating image segmentation models and evaluating their robustness, two additional datasets were used. The ImgCross dataset contains images of maize cobs and spindles derived from a cross of Peruvian landraces with a synthetic population generated from European elite breeding material, reflecting genetic segregation in the F2 generation. The ImgDiv dataset was obtained from publicly available South American maize genebank catalogs and special collections available as downloadable figures on the internet, exhibiting diverse image properties.
Note, that ImgDiv is not presented in DatasetNinja because corresponding images are not provided in the original dataset.
 Homepage
 Research Paper
 GitLab
Summary #
Maize Cobs: A Dataset for DeepCob Analysis is a dataset for instance segmentation, semantic segmentation, and object detection tasks. It is used in the agricultural industry, and in the genetic research.
The dataset consists of 1250 images with 8905 labeled objects belonging to 2 different classes including ruler and cob.
Images in the Maize Cobs dataset have pixel-level instance segmentation annotations. Due to the nature of the instance segmentation task, it can be automatically transformed into a semantic segmentation (only one mask for every class) or object detection (bounding boxes for every object) tasks. There are 4 (0% of the total) unlabeled images (i.e. without annotations). There are 2 splits in the dataset: train (800 images) and val (450 images). Alternatively, the dataset could be split into 3 versions: ImgOldImgNew-training-data-1000 (1000 images), ImgCross-training-data (150 images), and ImgOldImgNew-validation-data (100 images). The dataset was released in 2021 by the University of Hohenheim, Germany.
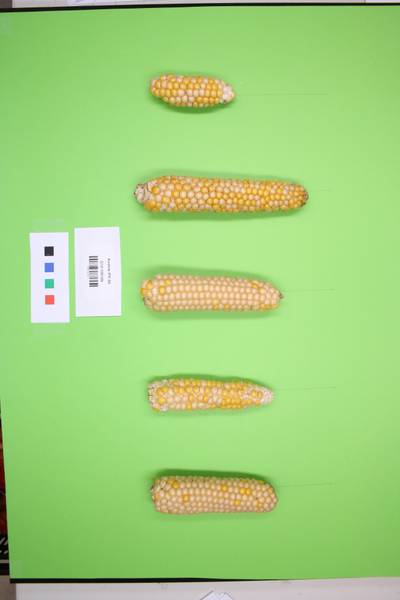
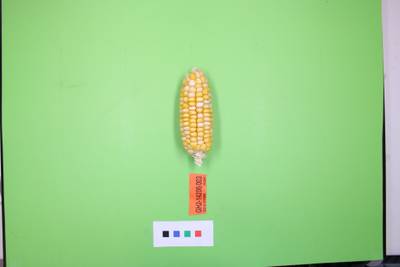
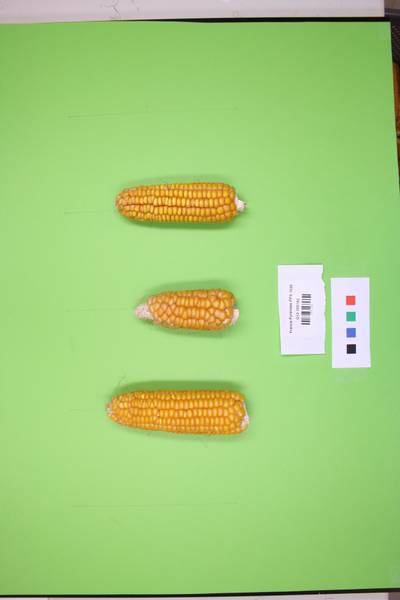
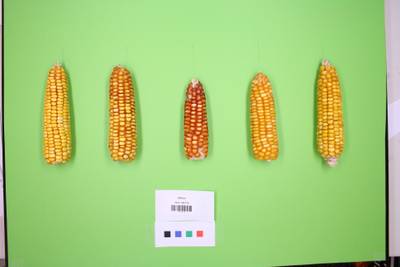
Here is the visualized example grid with animated annotations:
Explore #
Maize Cobs dataset has 1250 images. Click on one of the examples below or open "Explore" tool anytime you need to view dataset images with annotations. This tool has extended visualization capabilities like zoom, translation, objects table, custom filters and more. Hover the mouse over the images to hide or show annotations.


Class balance #
There are 2 annotation classes in the dataset. Find the general statistics and balances for every class in the table below. Click any row to preview images that have labels of the selected class. Sort by column to find the most rare or prevalent classes.

Class ㅤ | Images ㅤ | Objects ㅤ | Count on image average | Area on image average |
|---|---|---|---|---|
ruler➔ polygon | 1243 | 1950 | 1.57 | 6.72% |
cob➔ polygon | 1236 | 6955 | 5.63 | 22.89% |
Co-occurrence matrix #
Co-occurrence matrix is an extremely valuable tool that shows you the images for every pair of classes: how many images have objects of both classes at the same time. If you click any cell, you will see those images. We added the tooltip with an explanation for every cell for your convenience, just hover the mouse over a cell to preview the description.
Images #
Explore every single image in the dataset with respect to the number of annotations of each class it has. Click a row to preview selected image. Sort by any column to find anomalies and edge cases. Use horizontal scroll if the table has many columns for a large number of classes in the dataset.
Object distribution #
Interactive heatmap chart for every class with object distribution shows how many images are in the dataset with a certain number of objects of a specific class. Users can click cell and see the list of all corresponding images.
Class sizes #
The table below gives various size properties of objects for every class. Click a row to see the image with annotations of the selected class. Sort columns to find classes with the smallest or largest objects or understand the size differences between classes.
Class | Object count | Avg area | Max area | Min area | Min height | Min height | Max height | Max height | Avg height | Avg height | Min width | Min width | Max width | Max width |
|---|---|---|---|---|---|---|---|---|---|---|---|---|---|---|
cob polygon | 6955 | 4.02% | 14.42% | 0.66% | 129px | 4.24% | 1645px | 89.94% | 332px | 43.68% | 33px | 3.3% | 1699px | 91.1% |
ruler polygon | 1950 | 4.16% | 12.5% | 0.15% | 18px | 2.28% | 1983px | 92.49% | 312px | 44.68% | 11px | 1.1% | 4918px | 100% |
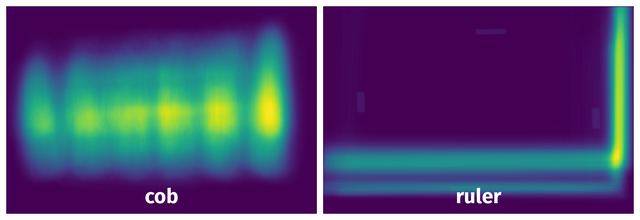
Spatial Heatmap #
The heatmaps below give the spatial distributions of all objects for every class. These visualizations provide insights into the most probable and rare object locations on the image. It helps analyze objects' placements in a dataset.
Objects #
Table contains all 8905 objects. Click a row to preview an image with annotations, and use search or pagination to navigate. Sort columns to find outliers in the dataset.
Object ID ㅤ | Class ㅤ | Image name click row to open | Image size height x width | Height ㅤ | Height ㅤ | Width ㅤ | Width ㅤ | Area ㅤ |
|---|---|---|---|---|---|---|---|---|
1➔ | ruler polygon | ANC-036.jpg | 666 x 1000 | 42px | 6.31% | 962px | 96.2% | 4.04% |
2➔ | ruler polygon | ANC-036.jpg | 666 x 1000 | 494px | 74.17% | 29px | 2.9% | 1.99% |
3➔ | cob polygon | ANC-036.jpg | 666 x 1000 | 237px | 35.59% | 117px | 11.7% | 3.23% |
4➔ | cob polygon | ANC-036.jpg | 666 x 1000 | 260px | 39.04% | 103px | 10.3% | 2.9% |
5➔ | cob polygon | ANC-036.jpg | 666 x 1000 | 294px | 44.14% | 88px | 8.8% | 3.11% |
6➔ | cob polygon | ANC-036.jpg | 666 x 1000 | 303px | 45.5% | 100px | 10% | 3.5% |
7➔ | cob polygon | ANC-036.jpg | 666 x 1000 | 308px | 46.25% | 119px | 11.9% | 3.97% |
8➔ | cob polygon | ANC-036.jpg | 666 x 1000 | 304px | 45.65% | 124px | 12.4% | 4.65% |
9➔ | cob polygon | ANC-036.jpg | 666 x 1000 | 307px | 46.1% | 102px | 10.2% | 3.69% |
10➔ | ruler polygon | ANC-554.jpg | 666 x 1000 | 30px | 4.5% | 889px | 88.9% | 3.42% |
License #
Maize Cobs: A Dataset for DeepCob Analysis is under CC BY-NC 2.0 license.
Citation #
If you make use of the Maize Cobs data, please cite the following reference:
@misc{lydia_kienbaum_2021_4587304,
  author       = {Lydia Kienbaum and
                  Miguel Correa Abondano and
                  Raul Blas and
                  Karl Schmid},
  title        = {{DeepCob: Precise and high-throughput analysis of
                   maize cob geometry using deep learning with an
                   application in genebank phenomics}},
  month        = mar,
  year         = 2021,
  publisher    = {Zenodo},
  doi          = {10.5281/zenodo.4587304},
  url          = {https://doi.org/10.5281/zenodo.4587304}
}
If you are happy with Dataset Ninja and use provided visualizations and tools in your work, please cite us:
@misc{ visualization-tools-for-maize-cobs-dataset,
  title = { Visualization Tools for Maize Cobs Dataset },
  type = { Computer Vision Tools },
  author = { Dataset Ninja },
  howpublished = { \url{ https://datasetninja.com/maize-cobs } },
  url = { https://datasetninja.com/maize-cobs },
  journal = { Dataset Ninja },
  publisher = { Dataset Ninja },
  year = { 2026 },
  month = { feb },
  note = { visited on 2026-02-01 },
}
Download #
Dataset Maize Cobs can be downloaded in Supervisely format:
As an alternative, it can be downloaded with dataset-tools package:
pip install --upgrade dataset-tools
… using following python code:
import dataset_tools as dtools

dtools.download(dataset='Maize Cobs', dst_dir='~/dataset-ninja/')
Make sure not to overlook the python code example available on the Supervisely Developer Portal. It will give you a clear idea of how to effortlessly work with the downloaded dataset.
The data in original format can be downloaded here:
Disclaimer #
Our gal from the legal dep told us we need to post this:
Dataset Ninja provides visualizations and statistics for some datasets that can be found online and can be downloaded by general audience. Dataset Ninja is not a dataset hosting platform and can only be used for informational purposes. The platform does not claim any rights for the original content, including images, videos, annotations and descriptions. Joint publishing is prohibited.
You take full responsibility when you use datasets presented at Dataset Ninja, as well as other information, including visualizations and statistics we provide. You are in charge of compliance with any dataset license and all other permissions. You are required to navigate datasets homepage and make sure that you can use it. In case of any questions, get in touch with us at hello@datasetninja.com.