

Introduction #
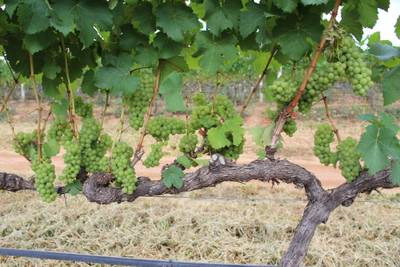
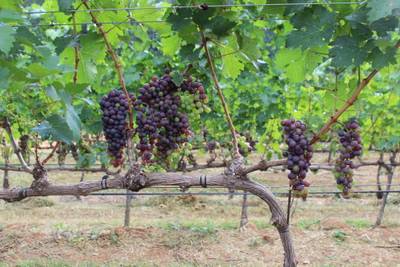
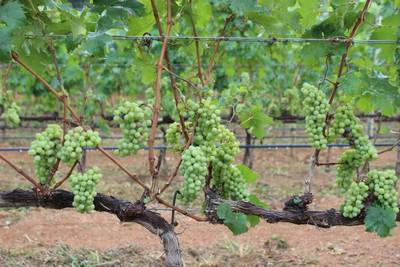
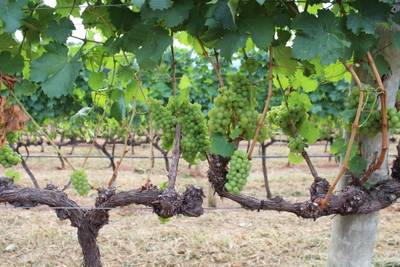
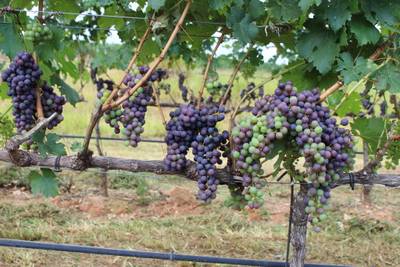
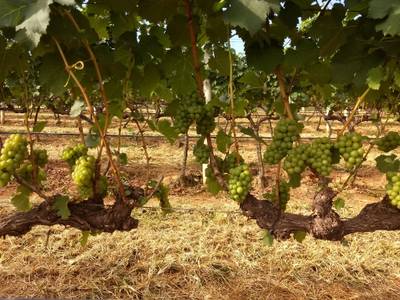
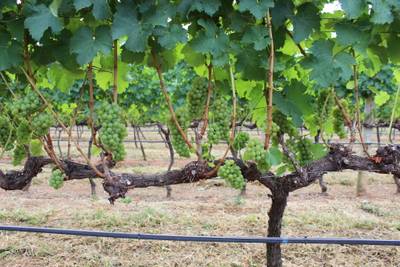
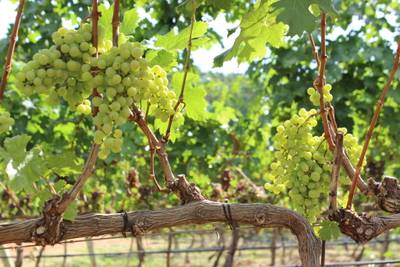
The authors of the Embrapa WGISD: Embrapa Wine Grape Instance Segmentation Dataset aim to provide images and annotations for studying object detection and instance segmentation in viticulture for image-based monitoring and field robotics. The dataset includes instances from five different grape varieties captured in the field, exhibiting variations in grape pose, illumination, and focus, as well as genetic and phenological characteristics such as shape, color, and compactness.
The mentioned challenges of automation in agriculture, particularly in outdoor environments and uncertain plant structures, require advanced monitoring systems capable of fine-grained detection and localization of plant structures and fruits. Accurate fruit detection and localization are essential for various agricultural applications, including fruit counting, yield estimation, precision agriculture, disease monitoring, nutrient deficiency detection, and actuation tasks like automated spraying and harvesting.
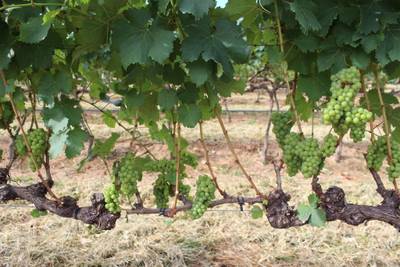
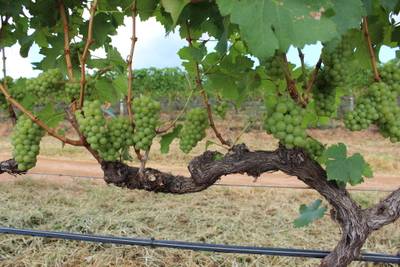
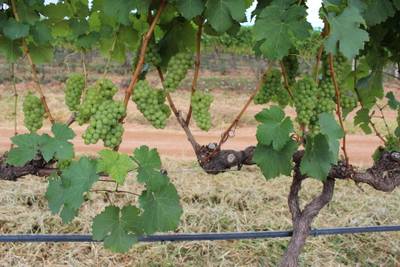
Embrapa WGISD consists of 300 RGB images showcasing 4,432 grape clusters from five different grape varieties, as summarized in Table 1. The images were captured from a single winery, which employed dual pruning for shaping and production, resulting in canopies of lower density. The dataset represents real-world, trellis system-based wine grape production, and no specific intervention was performed for dataset construction. The camera captures frontal pose images, where the principal axis is approximately perpendicular to the wires of the trellis system and plant rows.
| Prefix | Variety | Date | Images | Boxed clusters | Masked clusters |
|---|---|---|---|---|---|
| CDY | chardonnay | 2018-04-27 | 65 | 840 | 308 |
| CFR | cabernet eranc | 2018-04-27 | 65 | 1,069 | 513 |
| CSV | cabernet sauvignon | 2018-04-27 | 57 | 643 | 306 |
| SVB | sauvignon blanc | 2018-04-27 | 65 | 1,317 | 608 |
| SYH | syrah | 2017-04-27 | 48 | 563 | 285 |
| Total | 300 | 4,432 | 2,020 |
The dataset provides binary masks for 2,020 clusters out of 4,432, used for supervised instance segmentation training.
The images were captured at the vineyards of Guaspari Winery in São Paulo, Brazil, with dual pruning performed by the winery staff. A Canon EOS REBEL T3i DSLR camera and a Motorola Z2 Play smartphone were used to capture the images. The cameras were positioned between the vine lines, facing the vines at distances of around 1-2 meters. The REBEL camera captured 240 images, including all Syrah pictures, while the Z2 smartphone captured 60 images covering all other varieties except Syrah. The REBEL images were scaled to 2048 × 1365 pixels, and the Z2 images were scaled to 2048 × 1536 pixels. More detailed information about the capture process can be found in the Exif data in the original image files, which are part of the dataset.
 Homepage
 Research Paper
 GitHub
Summary #
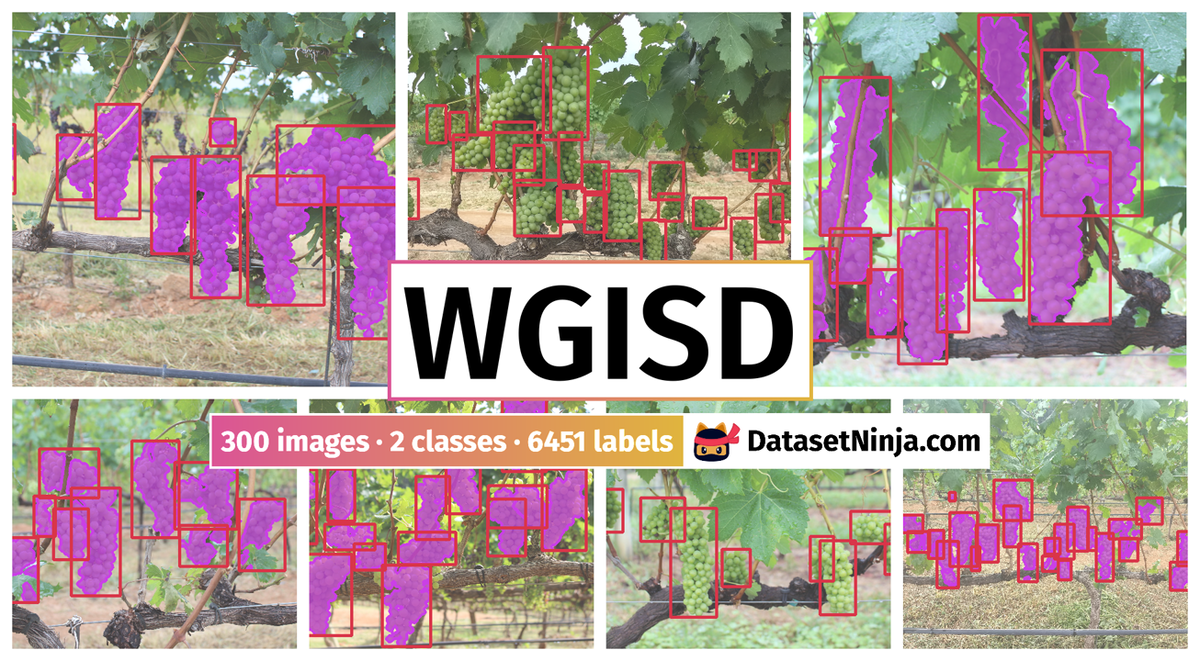
Embrapa WGISD: Embrapa Wine Grape Instance Segmentation Dataset is a dataset for instance segmentation, semantic segmentation, and object detection tasks. It is used in the agricultural industry.
The dataset consists of 300 images with 6451 labeled objects belonging to 2 different classes including uva_bbox and uva.
Images in the WGISD dataset have pixel-level instance segmentation and bounding box annotations. Due to the nature of the instance segmentation task, it can be automatically transformed into a semantic segmentation task (only one mask for every class). All images are labeled (i.e. with annotations). There are 2 splits in the dataset: train (242 images) and test (58 images). Alternatively, the dataset could be split into 5 variety: cabernet franc (65 images), chardonnay (65 images), sauvignon blanc (65 images), cabernet sauvignon (57 images), and syrah (48 images). The dataset was released in 2019 by the Embrapa Agricultural Informatics, Brazil and Institute of Computing, University of Campinas, Brazil.
Explore #
WGISD dataset has 300 images. Click on one of the examples below or open "Explore" tool anytime you need to view dataset images with annotations. This tool has extended visualization capabilities like zoom, translation, objects table, custom filters and more. Hover the mouse over the images to hide or show annotations.


Class balance #
There are 2 annotation classes in the dataset. Find the general statistics and balances for every class in the table below. Click any row to preview images that have labels of the selected class. Sort by column to find the most rare or prevalent classes.

Class ㅤ | Images ㅤ | Objects ㅤ | Count on image average | Area on image average |
|---|---|---|---|---|
uva_bbox➔ rectangle | 300 | 4432 | 14.77 | 18.65% |
uva➔ mask | 137 | 2019 | 14.74 | 11.41% |
Co-occurrence matrix #
Co-occurrence matrix is an extremely valuable tool that shows you the images for every pair of classes: how many images have objects of both classes at the same time. If you click any cell, you will see those images. We added the tooltip with an explanation for every cell for your convenience, just hover the mouse over a cell to preview the description.
Images #
Explore every single image in the dataset with respect to the number of annotations of each class it has. Click a row to preview selected image. Sort by any column to find anomalies and edge cases. Use horizontal scroll if the table has many columns for a large number of classes in the dataset.
Object distribution #
Interactive heatmap chart for every class with object distribution shows how many images are in the dataset with a certain number of objects of a specific class. Users can click cell and see the list of all corresponding images.
Class sizes #
The table below gives various size properties of objects for every class. Click a row to see the image with annotations of the selected class. Sort columns to find classes with the smallest or largest objects or understand the size differences between classes.
Class | Object count | Avg area | Max area | Min area | Min height | Min height | Max height | Max height | Avg height | Avg height | Min width | Min width | Max width | Max width |
|---|---|---|---|---|---|---|---|---|---|---|---|---|---|---|
uva_bbox rectangle | 4432 | 1.38% | 12.2% | 0% | 2px | 0.15% | 812px | 59.49% | 235px | 16.87% | 1px | 0.05% | 551px | 26.9% |
uva mask | 2019 | 0.77% | 4.53% | 0.01% | 26px | 1.69% | 808px | 59.19% | 232px | 16.68% | 20px | 0.98% | 487px | 23.78% |
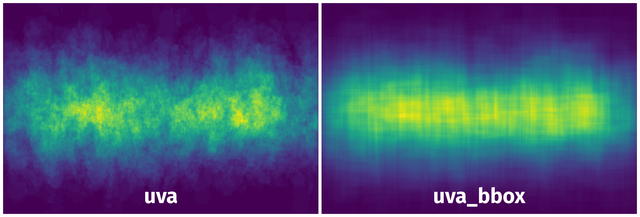
Spatial Heatmap #
The heatmaps below give the spatial distributions of all objects for every class. These visualizations provide insights into the most probable and rare object locations on the image. It helps analyze objects' placements in a dataset.
Objects #
Table contains all 6451 objects. Click a row to preview an image with annotations, and use search or pagination to navigate. Sort columns to find outliers in the dataset.
Object ID ㅤ | Class ㅤ | Image name click row to open | Image size height x width | Height ㅤ | Height ㅤ | Width ㅤ | Width ㅤ | Area ㅤ |
|---|---|---|---|---|---|---|---|---|
1➔ | uva_bbox rectangle | CSV_1887.jpeg | 1365 x 2048 | 382px | 27.99% | 153px | 7.47% | 2.09% |
2➔ | uva_bbox rectangle | CSV_1887.jpeg | 1365 x 2048 | 185px | 13.55% | 87px | 4.25% | 0.58% |
3➔ | uva_bbox rectangle | CSV_1887.jpeg | 1365 x 2048 | 167px | 12.23% | 192px | 9.38% | 1.15% |
4➔ | uva_bbox rectangle | CSV_1887.jpeg | 1365 x 2048 | 262px | 19.19% | 134px | 6.54% | 1.26% |
5➔ | uva_bbox rectangle | CSV_1887.jpeg | 1365 x 2048 | 299px | 21.9% | 128px | 6.25% | 1.37% |
6➔ | uva_bbox rectangle | CSV_1887.jpeg | 1365 x 2048 | 334px | 24.47% | 235px | 11.47% | 2.81% |
7➔ | uva_bbox rectangle | CSV_1887.jpeg | 1365 x 2048 | 233px | 17.07% | 139px | 6.79% | 1.16% |
8➔ | uva_bbox rectangle | CSV_1887.jpeg | 1365 x 2048 | 269px | 19.71% | 159px | 7.76% | 1.53% |
9➔ | uva_bbox rectangle | CSV_1887.jpeg | 1365 x 2048 | 103px | 7.55% | 125px | 6.1% | 0.46% |
10➔ | uva_bbox rectangle | CSV_1887.jpeg | 1365 x 2048 | 213px | 15.6% | 89px | 4.35% | 0.68% |
License #
Embrapa WGISD: Embrapa Wine Grape Instance Segmentation Dataset is under CC BY-NC-SA 4.0 license.
Citation #
If you make use of the WGISD data, please cite the following reference:
@dataset{thiago_santos_2019_3361736,
  author       = {Thiago Santos and
                  de Souza, Leonardo and
                  dos Santos Andreza and
                  Avila, Sandra},
  title        = {{Embrapa Wine Grape Instance Segmentation Dataset –
                   Embrapa WGISD}},
  month        = jul,
  year         = 2019,
  note         = {{The building of the WGISD dataset was supported by
                   the Embrapa SEG Project 01.14.09.001.05.04, Image-
                   based metrology for Precision Agriculture and
                   Phenotyping, and the CNPq PIBIC Program (grants
                   161165/2017-6 and 125044/2018-6).}},
  publisher    = {Zenodo},
  version      = {1.0.0},
  doi          = {10.5281/zenodo.3361736},
  url          = {https://doi.org/10.5281/zenodo.3361736}
}
If you are happy with Dataset Ninja and use provided visualizations and tools in your work, please cite us:
@misc{ visualization-tools-for-wgisd-dataset,
  title = { Visualization Tools for WGISD Dataset },
  type = { Computer Vision Tools },
  author = { Dataset Ninja },
  howpublished = { \url{ https://datasetninja.com/wgisd } },
  url = { https://datasetninja.com/wgisd },
  journal = { Dataset Ninja },
  publisher = { Dataset Ninja },
  year = { 2026 },
  month = { apr },
  note = { visited on 2026-04-07 },
}
Download #
Dataset WGISD can be downloaded in Supervisely format:
As an alternative, it can be downloaded with dataset-tools package:
pip install --upgrade dataset-tools
… using following python code:
import dataset_tools as dtools

dtools.download(dataset='WGISD', dst_dir='~/dataset-ninja/')
Make sure not to overlook the python code example available on the Supervisely Developer Portal. It will give you a clear idea of how to effortlessly work with the downloaded dataset.
The data in original format can be downloaded here.
Disclaimer #
Our gal from the legal dep told us we need to post this:
Dataset Ninja provides visualizations and statistics for some datasets that can be found online and can be downloaded by general audience. Dataset Ninja is not a dataset hosting platform and can only be used for informational purposes. The platform does not claim any rights for the original content, including images, videos, annotations and descriptions. Joint publishing is prohibited.
You take full responsibility when you use datasets presented at Dataset Ninja, as well as other information, including visualizations and statistics we provide. You are in charge of compliance with any dataset license and all other permissions. You are required to navigate datasets homepage and make sure that you can use it. In case of any questions, get in touch with us at hello@datasetninja.com.