Introduction #
The authors of Alfalfa Roots: Data for Manuscript on Objective Phenotyping of Alfalfa Root mention that in the realm of root system architecture (RSA) phenotyping, dedicated breeding programs remain a rarity. Nevertheless, ongoing efforts in the alfalfa crop involve breeding for branch and taproot types. Typically, phenotyping in this and other crops for RSA breeding primarily relies on visual trait scoring or subjective root type classification. Although image-based methods have been developed, their practical application in breeding remains limited. The authors’ research endeavors to pioneer and evaluate image-based RSA phenotyping techniques using machine and deep learning algorithms for objective classification. The dataset comprises 617 root images extracted from mature alfalfa plants cultivated in the field, aiding ongoing breeding initiatives. The authors of the dataset reveal compelling findings, with unsupervised machine learning often misclassifying roots into a normal distribution, predominantly predicting intermediate root types.
Alfalfa, scientifically known as Medicago sativa L. or lucerne, is a perennial forage crop of widespread cultivation. It offers several years of soil coverage and accumulates belowground biomass over time. Alfalfa boasts an extensive root system capable of extracting water and nutrients from depths of up to 6 meters. This deep root system plays a pivotal role in carbon sequestration and can also fix a substantial amount of nitrogen through biological nitrogen fixation. However, breeding efforts have primarily focused on aboveground traits, lagging behind in the selection of root system architecture (RSA) traits. The plasticity of root morphology in soil and the challenge of measuring RSA traits have contributed to this gap.
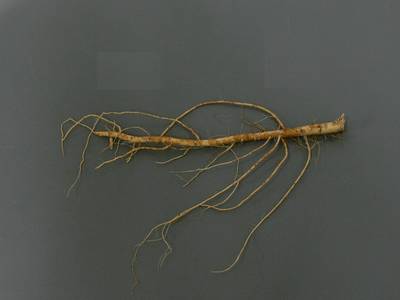
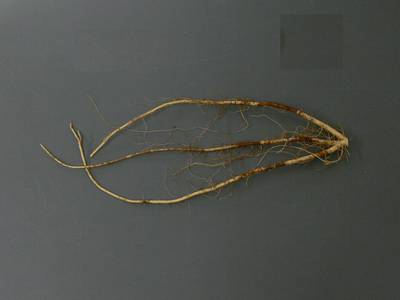
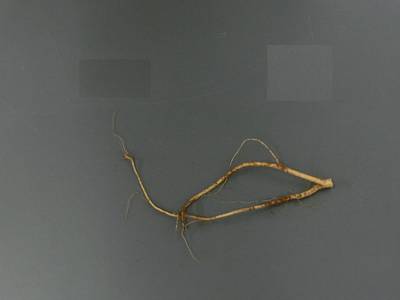
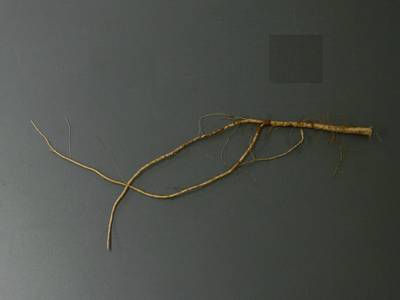
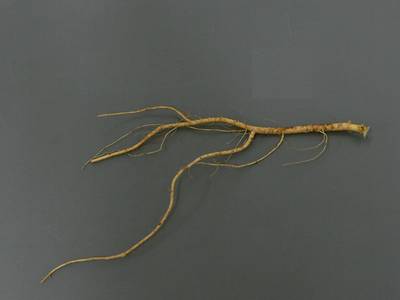
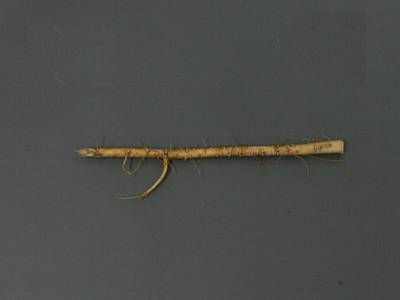
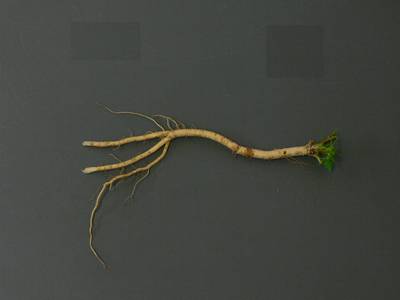
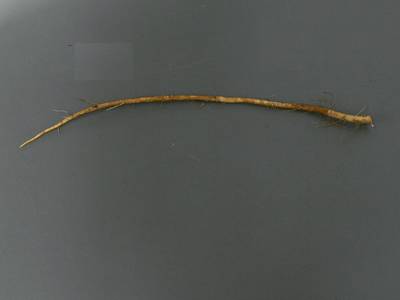
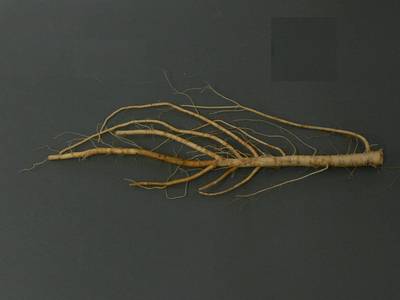
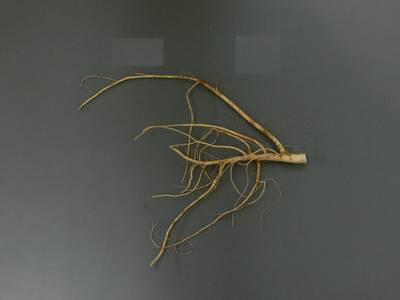
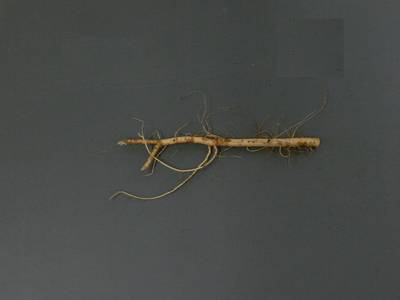
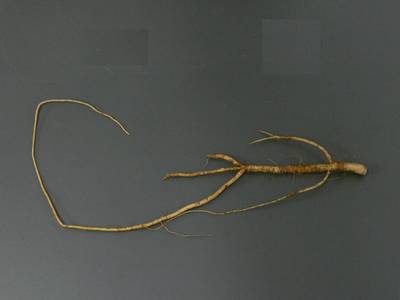
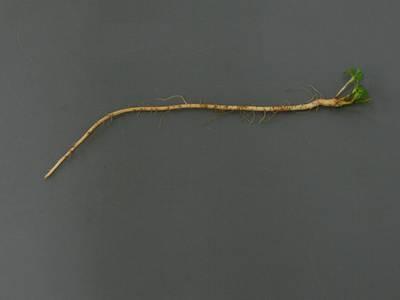
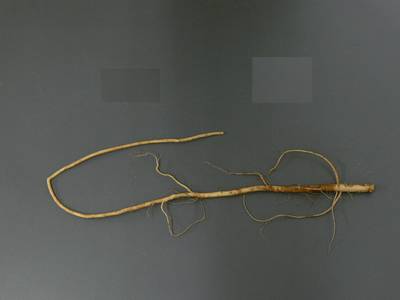
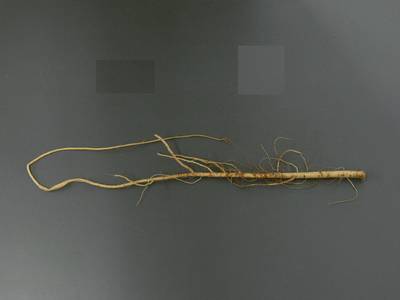
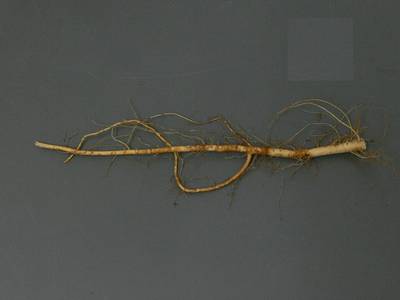
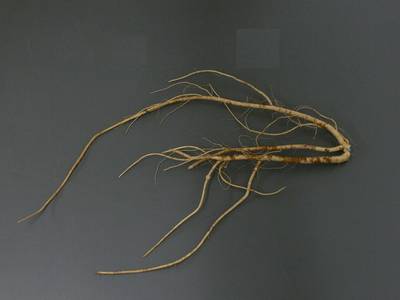
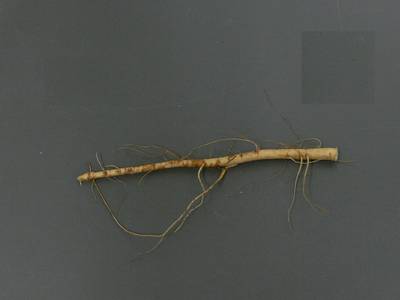
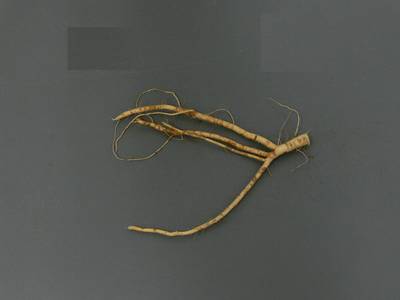
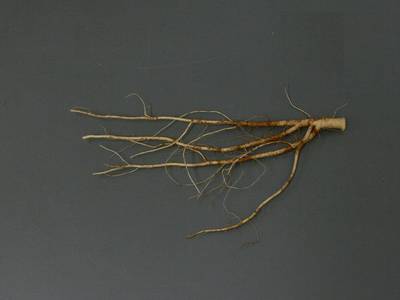
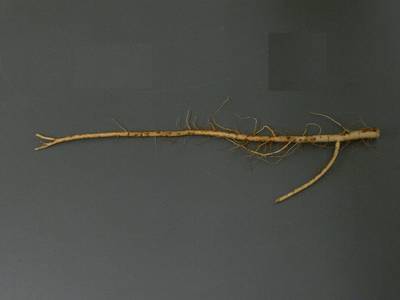
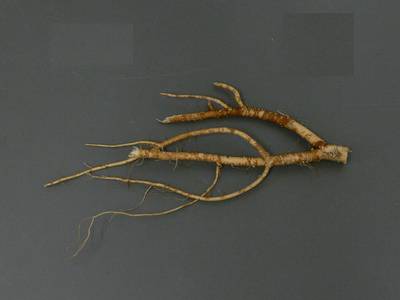
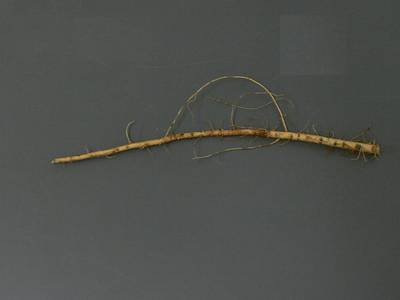
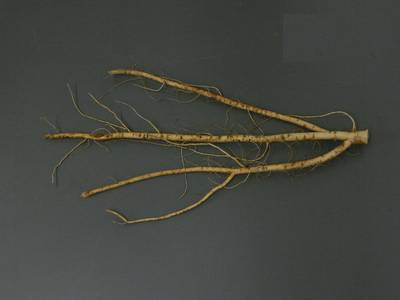
The study utilized five alfalfa populations created based on RSA types through cycles of phenotypic selection. The populations included: (a) branch root, (b) taproot, and (c) intermediate root types:
To segment roots from the background in the images, the RootPainter software was employed, and a neural network was trained for batch segmentation. The segmented images were then converted to binary format for further analysis. RhizoVision Explorer was used for feature extraction, generating data on various root traits. These traits included tip number, branch number, branching density, length, area, volume, number of roots, root system width and depth, convex hull area, number, and area of holes, angle frequencies, average, median, and maximum diameter, as well as length, surface area, and volume within specific diameter ranges.
Summary #
Alfalfa Roots: Data for Manuscript on Objective Phenotyping of Alfalfa Roots is a dataset for semantic segmentation and unsupervised learning tasks. It is used in the biological research.
The dataset consists of 617 images with 617 labeled objects belonging to 1 single class (root).
Images in the Alfalfa Roots dataset have pixel-level semantic segmentation annotations. All images are labeled (i.e. with annotations). There are no pre-defined train/val/test splits in the dataset. The dataset was released in 2022 by the USA joint research group.

Explore #
Alfalfa Roots dataset has 617 images. Click on one of the examples below or open "Explore" tool anytime you need to view dataset images with annotations. This tool has extended visualization capabilities like zoom, translation, objects table, custom filters and more. Hover the mouse over the images to hide or show annotations.






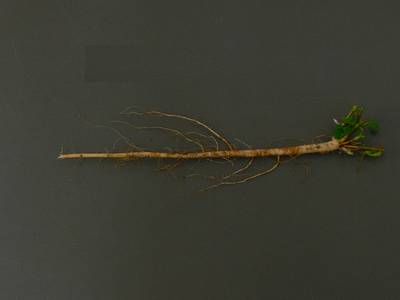

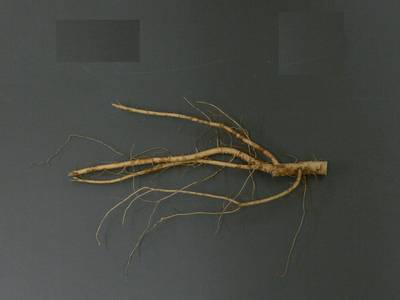

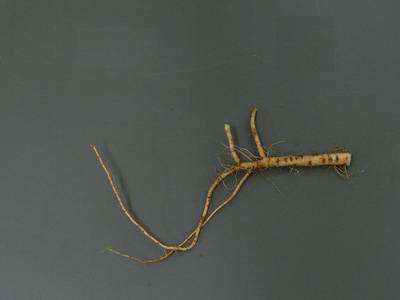

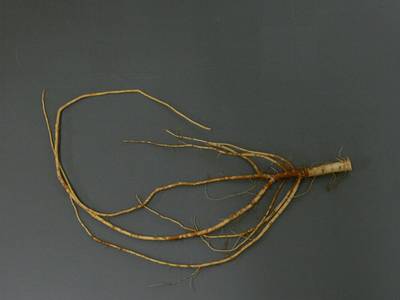





















Class balance #
There are 1 annotation classes in the dataset. Find the general statistics and balances for every class in the table below. Click any row to preview images that have labels of the selected class. Sort by column to find the most rare or prevalent classes.
Class ㅤ | Images ㅤ | Objects ㅤ | Count on image average | Area on image average |
|---|---|---|---|---|
root➔ mask | 617 | 620 | 1 | 4% |
Images #
Explore every single image in the dataset with respect to the number of annotations of each class it has. Click a row to preview selected image. Sort by any column to find anomalies and edge cases. Use horizontal scroll if the table has many columns for a large number of classes in the dataset.
Object distribution #
Interactive heatmap chart for every class with object distribution shows how many images are in the dataset with a certain number of objects of a specific class. Users can click cell and see the list of all corresponding images.
Class sizes #
The table below gives various size properties of objects for every class. Click a row to see the image with annotations of the selected class. Sort columns to find classes with the smallest or largest objects or understand the size differences between classes.
Class | Object count | Avg area | Max area | Min area | Min height | Min height | Max height | Max height | Avg height | Avg height | Min width | Min width | Max width | Max width |
|---|---|---|---|---|---|---|---|---|---|---|---|---|---|---|
root mask | 620 | 3.98% | 9.01% | 0.22% | 60px | 6.25% | 752px | 78.33% | 437px | 45.5% | 80px | 6.25% | 1224px | 95.62% |
Spatial Heatmap #
The heatmaps below give the spatial distributions of all objects for every class. These visualizations provide insights into the most probable and rare object locations on the image. It helps analyze objects' placements in a dataset.

Objects #
Table contains all 620 objects. Click a row to preview an image with annotations, and use search or pagination to navigate. Sort columns to find outliers in the dataset.
Object ID ㅤ | Class ㅤ | Image name click row to open | Image size height x width | Height ㅤ | Height ㅤ | Width ㅤ | Width ㅤ | Area ㅤ |
|---|---|---|---|---|---|---|---|---|
1➔ | root mask | P1120383_ADJ.tif.tiff | 960 x 1280 | 315px | 32.81% | 1066px | 83.28% | 4.02% |
2➔ | root mask | P1120377_ADJ.tif.tiff | 960 x 1280 | 570px | 59.38% | 988px | 77.19% | 6.25% |
3➔ | root mask | P1120644_ADJ.tif.tiff | 960 x 1280 | 407px | 42.4% | 932px | 72.81% | 3.24% |
4➔ | root mask | P1110937_ADJ.tif.tiff | 960 x 1280 | 424px | 44.17% | 1022px | 79.84% | 2.39% |
5➔ | root mask | P1120104_ADJ.tif.tiff | 960 x 1280 | 330px | 34.38% | 1088px | 85% | 2.9% |
6➔ | root mask | P1120846_ADJ.tif.tiff | 960 x 1280 | 587px | 61.15% | 1088px | 85% | 6.22% |
7➔ | root mask | P1110984_ADJ.tif.tiff | 960 x 1280 | 458px | 47.71% | 990px | 77.34% | 3.63% |
8➔ | root mask | P1120273_ADJ.tif.tiff | 960 x 1280 | 719px | 74.9% | 1016px | 79.38% | 8.36% |
9➔ | root mask | P1120849_ADJ.tif.tiff | 960 x 1280 | 558px | 58.12% | 951px | 74.3% | 7.01% |
10➔ | root mask | P1120447_ADJ.tif.tiff | 960 x 1280 | 572px | 59.58% | 900px | 70.31% | 4.16% |
License #
Citation #
If you make use of the Alfalfa Roots data, please cite the following reference:
@dataset{xu_zhanyou_2022_5879779,
  author       = {Xu, Zhanyou and
                  York, Larry M. and
                  Seethepalli, Anand and
                  Bucciarelli, Bruna and
                  Cheng, Hao and
                  Samac, Deborah},
  title        = {{Data for manuscript on objective phenotyping of
                   alfalfa roots}},
  month        = jan,
  year         = 2022,
  publisher    = {Zenodo},
  doi          = {10.5281/zenodo.5879779},
  url          = {https://doi.org/10.5281/zenodo.5879779}
}
If you are happy with Dataset Ninja and use provided visualizations and tools in your work, please cite us:
@misc{ visualization-tools-for-alfalfa-roots-dataset,
  title = { Visualization Tools for Alfalfa Roots Dataset },
  type = { Computer Vision Tools },
  author = { Dataset Ninja },
  howpublished = { \url{ https://datasetninja.com/alfalfa-roots } },
  url = { https://datasetninja.com/alfalfa-roots },
  journal = { Dataset Ninja },
  publisher = { Dataset Ninja },
  year = { 2026 },
  month = { feb },
  note = { visited on 2026-02-22 },
}
Download #
Dataset Alfalfa Roots can be downloaded in Supervisely format:
As an alternative, it can be downloaded with dataset-tools package:
pip install --upgrade dataset-tools
… using following python code:
import dataset_tools as dtools

dtools.download(dataset='Alfalfa Roots', dst_dir='~/dataset-ninja/')
Make sure not to overlook the python code example available on the Supervisely Developer Portal. It will give you a clear idea of how to effortlessly work with the downloaded dataset.
The data in original format can be downloaded here:
Disclaimer #
Our gal from the legal dep told us we need to post this:
Dataset Ninja provides visualizations and statistics for some datasets that can be found online and can be downloaded by general audience. Dataset Ninja is not a dataset hosting platform and can only be used for informational purposes. The platform does not claim any rights for the original content, including images, videos, annotations and descriptions. Joint publishing is prohibited.
You take full responsibility when you use datasets presented at Dataset Ninja, as well as other information, including visualizations and statistics we provide. You are in charge of compliance with any dataset license and all other permissions. You are required to navigate datasets homepage and make sure that you can use it. In case of any questions, get in touch with us at hello@datasetninja.com.


