Introduction #
The authors release BUP19: Sweet Pepper Dataset to explore the issue of generalisability of the large differences between cropping environments by considering a fruit (sweet pepper) that is grown using different cultivars (sub-species) and in different environments (field vs glasshouse). The authors perform an evaluation of sweet pepper detection, segmentation, and quality assessment. Evaluations show that while domain specific models yield higher performance on their source data, detection and segmentation of sweet pepper on unseen data is viable for agricultural robotics by exploiting multi-task learning.
Note, similar BUP19: Sweet Pepper Dataset datasets are also available on the DatasetNinja.com:
Motivation
The field of agricultural robotics is experiencing rapid growth, driven by advancements in computer vision, machine learning, and robotics, coupled with an increasing demand in agriculture. Despite these strides, a significant gap exists between the technology available and the diverse requirements of farming, primarily due to the substantial variations in cropping environments. This underscores the urgent need for models with enhanced generalizability.
Addressing this gap, the BUP19 dataset was meticulously curated, encompassing diverse domains, cultivars, cameras, and geographic locations. The authors leverage this dataset in both individual and combined approaches to assess the detection and classification of sweet peppers in the wild. They opt for Faster-RCNN for detection, benefiting from its seamless adaptability to multitask learning through the incorporation of the Mask-RCNN framework for instance-based segmentation.
In evaluating sub-class classification, with a focus on the accuracy of correct detections, the authors achieve an impressive accuracy score of 0.9 in cross-domain evaluations. Notably, their experiments reveal that intra-environmental inference tends to be suboptimal. However, by enriching the data through a combination of diverse datasets, the authors enhance performance by introducing greater diversity into the training data.
In summary, the presentation of unique and varied datasets exemplifies the capacity of multi-task learning to improve cross-dataset generalization. Concurrently, it emphasizes the crucial role of diverse data in the efficient training and evaluation of real-world systems.
Dataset description
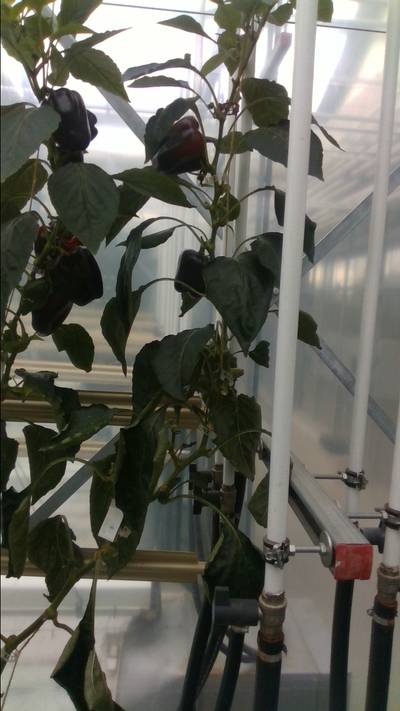
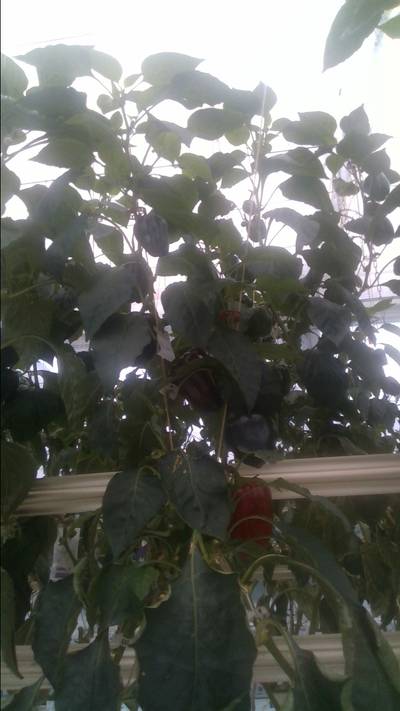
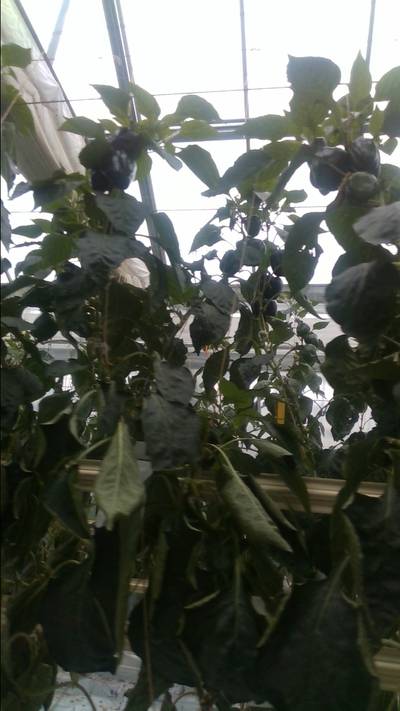
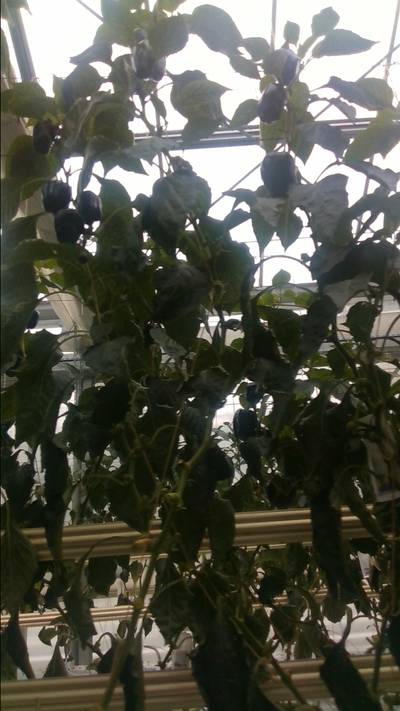
The BUP19 dataset was captured in a glass house replicating a commercial setting at Campus Klein-Altendorf. Two different cultivar of sweet pepper were grown simultaneously during experiments: Mazurka (Rijk Zwaan) and Mavras (Enza Zaden). The glass house for sweet pepper cultivation was arranged into six rows of approximately 40m in length each. Data was recorded into bagfiles using an Intel RealSense D435i camera at 30fps. For recording each row was separated into
four equally spaced sections. Post processing was completed to align the depth and RGB images using the pyrealsense23 libraries. The stored depth image is a uint16 TIFF format file where 1mm is represented by each change in value.
Example images from the BUP19 dataset: (a) is the raw image, (b) is a colourised version of the instance masks, (c)-(f) are representations of the instance masks for black, green, mixed, and red, and (g) is a quantized version of the depth image for visualisation.
For annotation, the glasshouse data was separated into three distinct sections: 1/3 training, 1/3 validation, and 1/3 evaluation. The separation of sections during recordings allowed for the data to be evenly split between each sub-set. Extending beyond bounding box regression, instance based masks are annotated. Annotation was completed by three individuals who annotated different images. A separate mask is included for each sub-class where zero denotes “background”, and a numbered response indicates the presence of a sweet pepper.
Summary #
BUP19: Sweet Pepper Dataset is a dataset for instance segmentation, semantic segmentation, object detection, and monocular depth estimation tasks. It is used in the agricultural and robotics industries.
The dataset consists of 572 images with 7448 labeled objects belonging to 4 different classes including black pepper, green pepper, mixed pepper, and other: red pepper.
Images in the BUP19 dataset have pixel-level instance segmentation and bounding box annotations. Due to the nature of the instance segmentation task, it can be automatically transformed into a semantic segmentation task (only one mask for every class). All images are labeled (i.e. with annotations). There are 3 splits in the dataset: train (228 images), test (176 images), and val (168 images). Additionally, images are grouped by im id. Also, every image in train dataset marked with alireza or claus tag. The dataset was released in 2019 by the University of Bonn, Germany.

Explore #
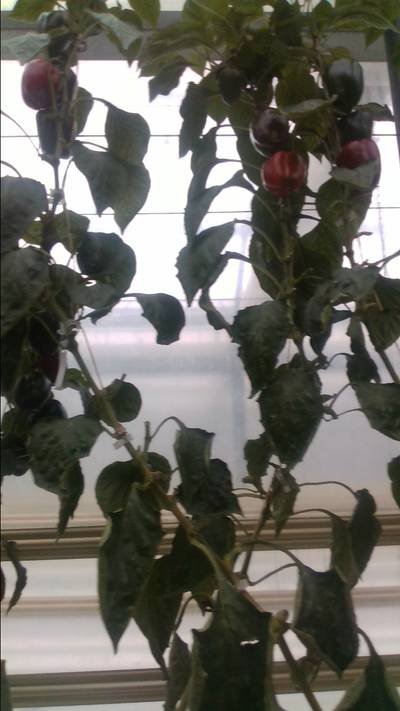
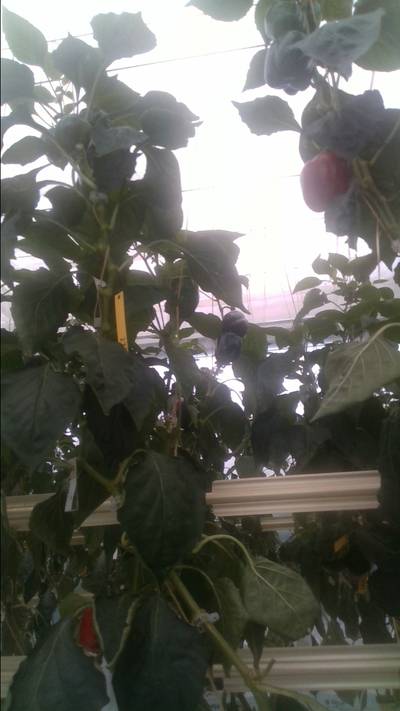
BUP19 dataset has 572 images. Click on one of the examples below or open "Explore" tool anytime you need to view dataset images with annotations. This tool has extended visualization capabilities like zoom, translation, objects table, custom filters and more. Hover the mouse over the images to hide or show annotations.














Class balance #
There are 4 annotation classes in the dataset. Find the general statistics and balances for every class in the table below. Click any row to preview images that have labels of the selected class. Sort by column to find the most rare or prevalent classes.
Class ㅤ | Images ㅤ | Objects ㅤ | Count on image average | Area on image average |
|---|---|---|---|---|
black pepper➔ any | 510 | 4160 | 8.16 | 2.07% |
green pepper➔ any | 458 | 2316 | 5.06 | 1.37% |
mixed pepper➔ any | 336 | 612 | 1.82 | 0.86% |
red pepper➔ any | 238 | 360 | 1.51 | 0.55% |
Co-occurrence matrix #
Co-occurrence matrix is an extremely valuable tool that shows you the images for every pair of classes: how many images have objects of both classes at the same time. If you click any cell, you will see those images. We added the tooltip with an explanation for every cell for your convenience, just hover the mouse over a cell to preview the description.
Images #
Explore every single image in the dataset with respect to the number of annotations of each class it has. Click a row to preview selected image. Sort by any column to find anomalies and edge cases. Use horizontal scroll if the table has many columns for a large number of classes in the dataset.
Object distribution #
Interactive heatmap chart for every class with object distribution shows how many images are in the dataset with a certain number of objects of a specific class. Users can click cell and see the list of all corresponding images.
Class sizes #
The table below gives various size properties of objects for every class. Click a row to see the image with annotations of the selected class. Sort columns to find classes with the smallest or largest objects or understand the size differences between classes.
Class | Object count | Avg area | Max area | Min area | Min height | Min height | Max height | Max height | Avg height | Avg height | Min width | Min width | Max width | Max width |
|---|---|---|---|---|---|---|---|---|---|---|---|---|---|---|
black pepper any | 4160 | 0.25% | 2.05% | 0% | 6px | 0.47% | 701px | 54.77% | 60px | 4.67% | 5px | 0.69% | 720px | 100% |
green pepper any | 2316 | 0.27% | 1.81% | 0.01% | 12px | 0.94% | 172px | 13.44% | 61px | 4.78% | 9px | 1.25% | 394px | 54.72% |
mixed pepper any | 612 | 0.47% | 1.77% | 0.01% | 12px | 0.94% | 639px | 49.92% | 81px | 6.35% | 13px | 1.81% | 570px | 79.17% |
red pepper any | 360 | 0.36% | 2.17% | 0.01% | 10px | 0.78% | 621px | 48.52% | 70px | 5.49% | 11px | 1.53% | 518px | 71.94% |
Spatial Heatmap #
The heatmaps below give the spatial distributions of all objects for every class. These visualizations provide insights into the most probable and rare object locations on the image. It helps analyze objects' placements in a dataset.

Objects #
Table contains all 7448 objects. Click a row to preview an image with annotations, and use search or pagination to navigate. Sort columns to find outliers in the dataset.
Object ID ㅤ | Class ㅤ | Image name click row to open | Image size height x width | Height ㅤ | Height ㅤ | Width ㅤ | Width ㅤ | Area ㅤ |
|---|---|---|---|---|---|---|---|---|
1➔ | black pepper any | frame_2019_10_1_8_39_0_205684.png | 1280 x 720 | 92px | 7.19% | 32px | 4.44% | 0.23% |
2➔ | green pepper any | frame_2019_10_1_8_39_0_205684.png | 1280 x 720 | 115px | 8.98% | 93px | 12.92% | 1% |
3➔ | green pepper any | frame_2019_10_1_8_39_0_205684.png | 1280 x 720 | 98px | 7.66% | 84px | 11.67% | 0.5% |
4➔ | green pepper any | frame_2019_10_1_8_39_0_205684.png | 1280 x 720 | 104px | 8.12% | 87px | 12.08% | 0.65% |
5➔ | black pepper any | frame_2019_10_29_8_48_29_015887.tiff | 1280 x 720 | 44px | 3.44% | 15px | 2.08% | 0.05% |
6➔ | black pepper any | frame_2019_10_29_8_48_29_015887.tiff | 1280 x 720 | 87px | 6.8% | 83px | 11.53% | 0.51% |
7➔ | green pepper any | frame_2019_10_29_8_48_29_015887.tiff | 1280 x 720 | 84px | 6.56% | 63px | 8.75% | 0.39% |
8➔ | green pepper any | frame_2019_10_29_8_48_29_015887.tiff | 1280 x 720 | 74px | 5.78% | 64px | 8.89% | 0.3% |
9➔ | mixed pepper any | frame_2019_10_29_8_48_29_015887.tiff | 1280 x 720 | 111px | 8.67% | 83px | 11.53% | 0.77% |
10➔ | mixed pepper any | frame_2019_10_29_8_48_29_015887.tiff | 1280 x 720 | 31px | 2.42% | 57px | 7.92% | 0.07% |
License #
License is unknown for the BUP19: Sweet Pepper Dataset dataset.
Citation #
If you make use of the BUP19 data, please cite the following reference:
@inproceedings{halstead2020fruit,
  title={Fruit detection in the wild: The impact of varying conditions and cultivar},
  author={Halstead, Michael and Denman, Simon and Fookes, Clinton and McCool, Chris},
  booktitle={2020 Digital Image Computing: Techniques and Applications (DICTA)},
  pages={1--8},
  year={2020},
  organization={IEEE}
}
If you are happy with Dataset Ninja and use provided visualizations and tools in your work, please cite us:
@misc{ visualization-tools-for-bup19-dataset,
  title = { Visualization Tools for BUP19 Dataset },
  type = { Computer Vision Tools },
  author = { Dataset Ninja },
  howpublished = { \url{ https://datasetninja.com/bup19 } },
  url = { https://datasetninja.com/bup19 },
  journal = { Dataset Ninja },
  publisher = { Dataset Ninja },
  year = { 2026 },
  month = { feb },
  note = { visited on 2026-02-22 },
}
Download #
Please visit dataset homepage to download the data.
Disclaimer #
Our gal from the legal dep told us we need to post this:
Dataset Ninja provides visualizations and statistics for some datasets that can be found online and can be downloaded by general audience. Dataset Ninja is not a dataset hosting platform and can only be used for informational purposes. The platform does not claim any rights for the original content, including images, videos, annotations and descriptions. Joint publishing is prohibited.
You take full responsibility when you use datasets presented at Dataset Ninja, as well as other information, including visualizations and statistics we provide. You are in charge of compliance with any dataset license and all other permissions. You are required to navigate datasets homepage and make sure that you can use it. In case of any questions, get in touch with us at hello@datasetninja.com.


