Introduction #
FICS PCB Image CollectionFPIC (FPIC) Component dataset is specifically designed for instance segmentation tasks. Comprising 6260 images, this dataset contains 29639 labeled objects distributed across 25 distinct classes, encompassing components such as C, R, U, as well as other classes like J, L, Q, P, and more. Derived from the FPIC dataset, this compilation involves the cropping of images representing 25 component classes. This dataset serves as a valuable resource for training models in instance segmentation, particularly focused on identifying and delineating various electronic component classes within PCB (Printed Circuit Board) images.
Authors propose PCBSegClassNet, a novel deep neural network for PCB component segmentation. The network uses a two-branch design that captures the global context in one branch and spatial features in the other. The fusion of two branches allows the effective segmentation of components of various sizes and shapes. They reinterpret the skip connections as a learning module to learn features efficiently.
Authors evaluate the performance on publicly available dataset FPIC (Jessurun et al., 2022). There are 230 images of 73 distinct PCBs in the dataset, taken from both the front and rear sides of the PCBs. Over 58,000 annotations are included in the images, including annotations for the text and any attached components. There are total of 58 different components annotated. Of these, we use 25 components for evaluation:
| No. | Component | Count | No. | Component | Count | No. | Component | Count |
|---|---|---|---|---|---|---|---|---|
| 1 | Resistor (R) | 7246 | 9 | Resistor Network (RN) | 330 | 17 | CRA | 54 |
| 2 | Capacitor (C) | 6896 | 10 | Test Point (TP) | 266 | 18 | Switch (SW) | 50 |
| 3 | Integrated Circuit (U) | 761 | 11 | Integrated Circuit (IC) | 237 | 19 | Transformer (T) | 47 |
| 4 | Discrete Transistor (Q) | 616 | 12 | Plug (P) | 200 | 20 | Fuse (F) | 44 |
| 5 | Connector (J) | 579 | 13 | Thyristor (CR) | 194 | 21 | Vaccum Tube (V) | 41 |
| 6 | Inductor (L) | 473 | 14 | Motor (M) | 74 | 22 | Light Emitting Diode (LED) | 39 |
| 7 | Resistor Coil (RA) | 404 | 15 | Button (BTN) | 72 | 23 | Switch (S) | 37 |
| 8 | Diode (D) | 362 | 16 | Ferrite Bead (FB) | 69 | 24 | QA | 36 |
| 25 | Jumper Link (JP) | 31 |
The “count” column shows the number of images of that component in the FPIC-component dataset.
The FPIC dataset provides images of the whole PCB. For performing component-level classification, authors create a new dataset named FPIC-component, which contains component images cropped from the PCB images. Figure bellow shows the steps taken to crop the component images; they are as follows:
- Perform contour operation on the ground truth mask to find the boundary of each component.
- From contour and boundary information, find a rectangular bounding box that covers the whole contour for everycomponent.
- From the rectangular bounding box, crop the component region from the original image.- Color information from the ground truth mask in the contour region provides us with the ground truth label for thecorresponding PCB component.
The resolution of PCB images in the FPIC dataset varies from 2266×1832 to 8291×6929. Thus, the highest resolutionimage has a resolution higher than that of even an 8K UHD (ultra-high definition) image. Since processing large images canoverwhelm the GPU, authors operate on image patches instead of the entire image. They have experimented with the patches of sizes 256×256,512×512,768×768, and 1024×1024. The results obtained with patches of size 1024×1024 and 768×768 werefound to be comparable, whereas smaller patch sizes provided inferior results. Hence, authors choose a patch size of 768×768,which captures the most representative sections without overwhelming the GPU. From this, they obtain 5048 patch images for train and 1262 patch images for val.
Summary #
FICS PCB Image CollectionFPIC (FPIC) Component is a dataset for instance segmentation, semantic segmentation, and object detection tasks. It is used in the waste recycling industry.
The dataset consists of 6260 images with 29639 labeled objects belonging to 25 different classes including C, R, U, and other: J, L, Q, P, D, IC, RN, CR, RA, M, T, V, TP, FB, S, BTN, CRA, QA, LED, F, SW, and JP.
Images in the FPIC-Component dataset have pixel-level instance segmentation annotations. Due to the nature of the instance segmentation task, it can be automatically transformed into a semantic segmentation (only one mask for every class) or object detection (bounding boxes for every object) tasks. There are 1608 (26% of the total) unlabeled images (i.e. without annotations). There are 2 splits in the dataset: train (5008 images) and val (1252 images). The dataset was released in 2023 by the Indian Institute of Technology.
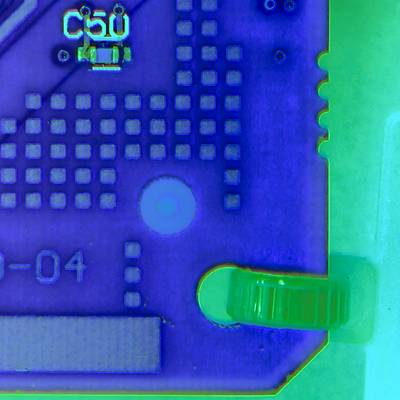
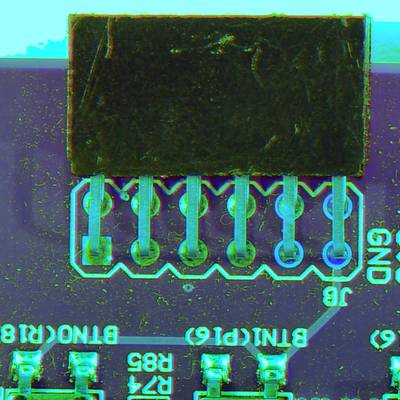
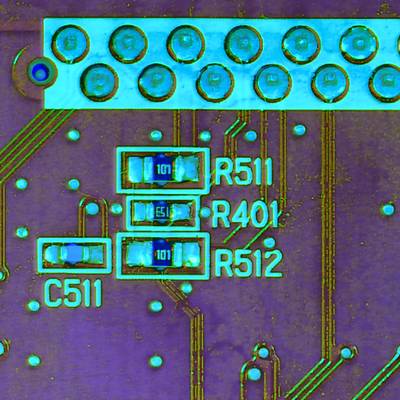
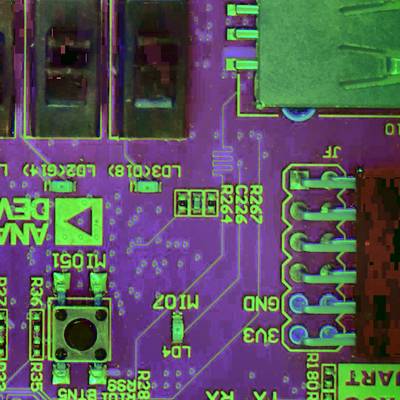
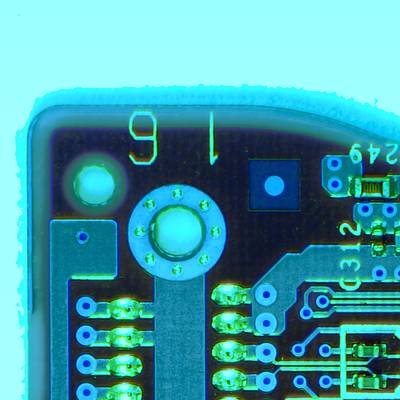
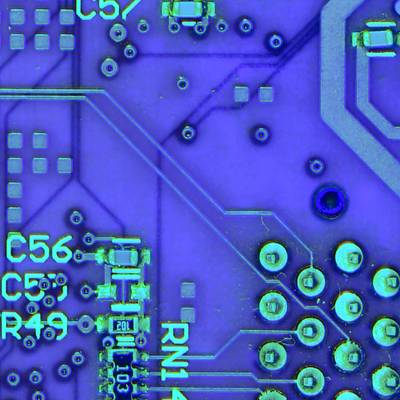
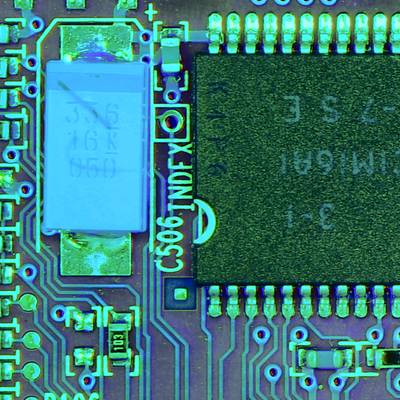
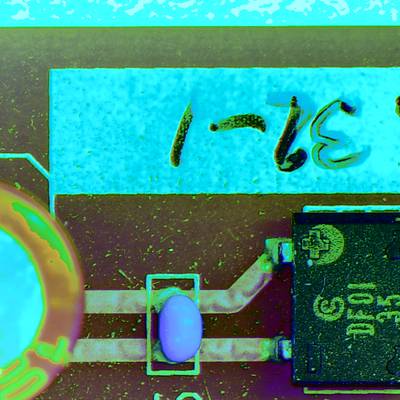
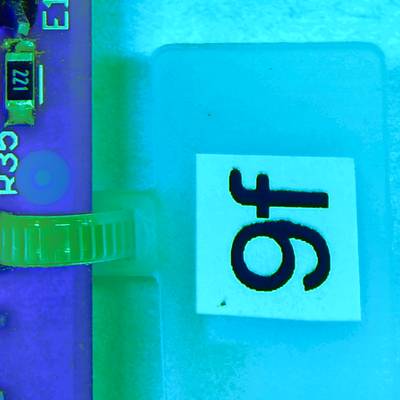
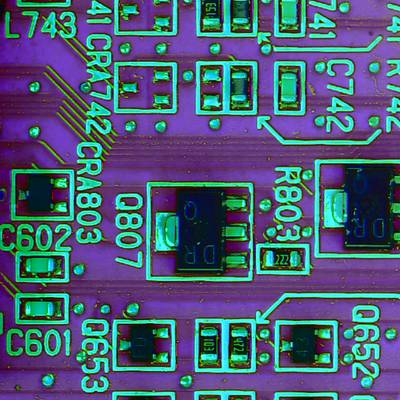
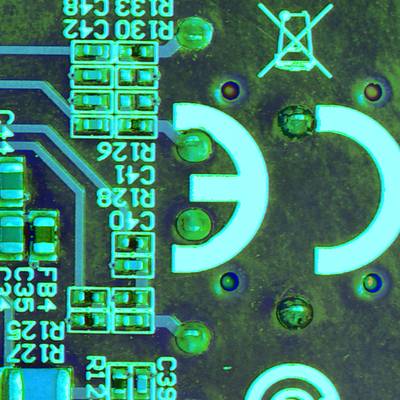
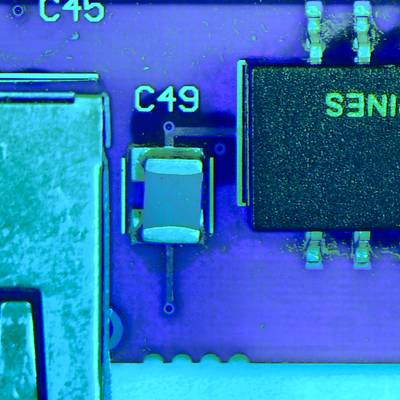
Here are the visualized examples for the classes:
Explore #
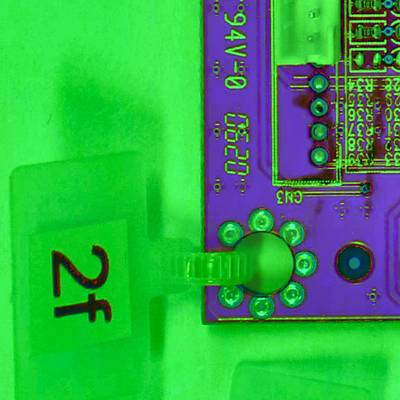
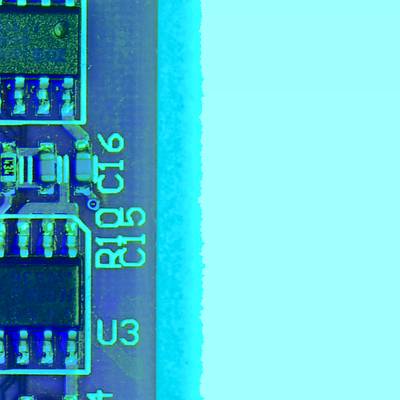
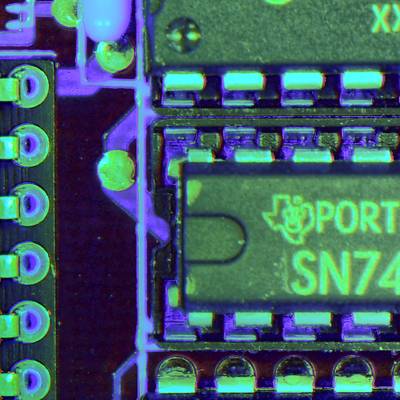
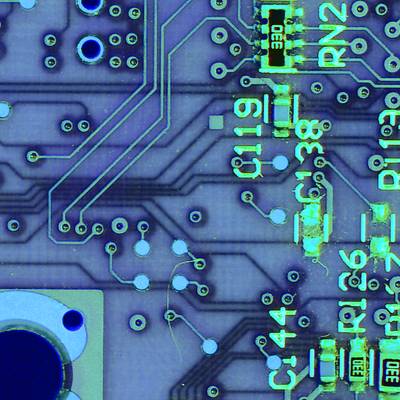
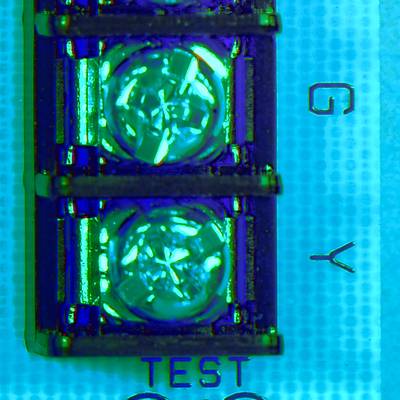
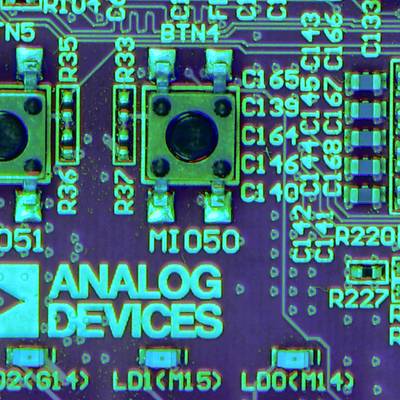
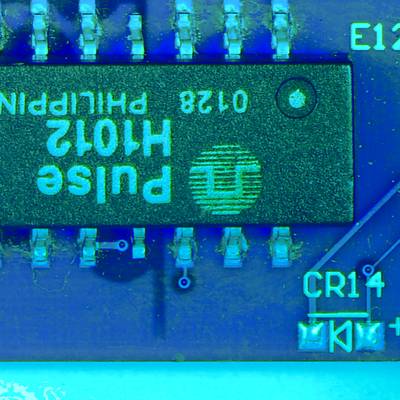
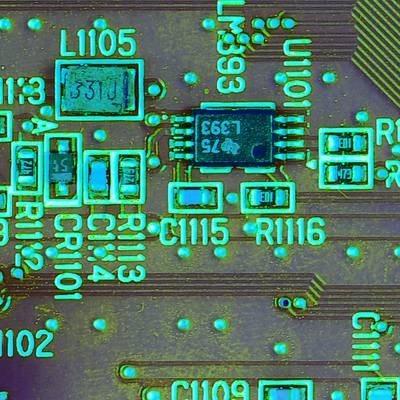
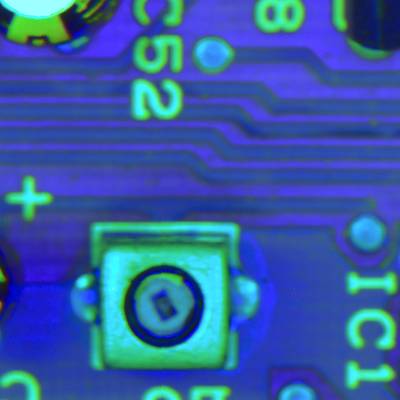
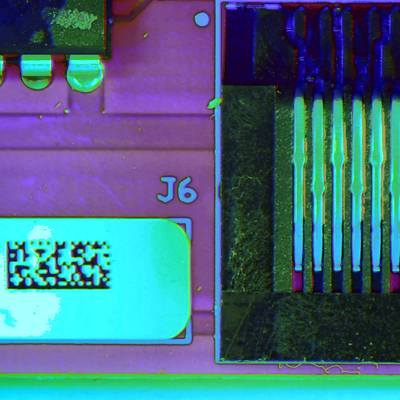
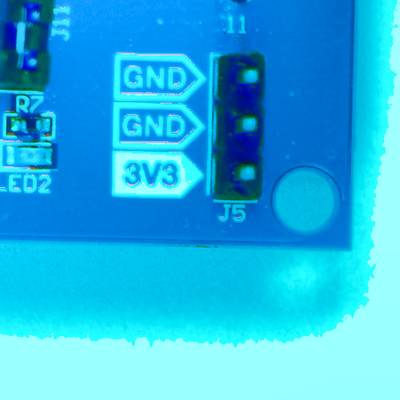
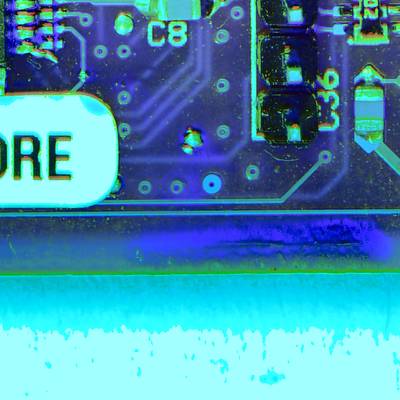
FPIC-Component dataset has 6260 images. Click on one of the examples below or open "Explore" tool anytime you need to view dataset images with annotations. This tool has extended visualization capabilities like zoom, translation, objects table, custom filters and more. Hover the mouse over the images to hide or show annotations.






























Class balance #
There are 25 annotation classes in the dataset. Find the general statistics and balances for every class in the table below. Click any row to preview images that have labels of the selected class. Sort by column to find the most rare or prevalent classes.
Class ㅤ | Images ㅤ | Objects ㅤ | Count on image average | Area on image average |
|---|---|---|---|---|
C➔ mask | 2600 | 8837 | 3.4 | 2.44% |
R➔ mask | 2502 | 9312 | 3.72 | 1.68% |
U➔ mask | 1331 | 3330 | 2.5 | 18.5% |
J➔ mask | 765 | 1489 | 1.95 | 16.79% |
L➔ mask | 491 | 776 | 1.58 | 2.89% |
Q➔ mask | 489 | 893 | 1.83 | 2.5% |
P➔ mask | 466 | 667 | 1.43 | 19.19% |
D➔ mask | 347 | 597 | 1.72 | 1.59% |
IC➔ mask | 297 | 603 | 2.03 | 14.58% |
RN➔ mask | 286 | 513 | 1.79 | 2.5% |
Co-occurrence matrix #
Co-occurrence matrix is an extremely valuable tool that shows you the images for every pair of classes: how many images have objects of both classes at the same time. If you click any cell, you will see those images. We added the tooltip with an explanation for every cell for your convenience, just hover the mouse over a cell to preview the description.
Images #
Explore every single image in the dataset with respect to the number of annotations of each class it has. Click a row to preview selected image. Sort by any column to find anomalies and edge cases. Use horizontal scroll if the table has many columns for a large number of classes in the dataset.
Object distribution #
Interactive heatmap chart for every class with object distribution shows how many images are in the dataset with a certain number of objects of a specific class. Users can click cell and see the list of all corresponding images.
Class sizes #
The table below gives various size properties of objects for every class. Click a row to see the image with annotations of the selected class. Sort columns to find classes with the smallest or largest objects or understand the size differences between classes.
Class | Object count | Avg area | Max area | Min area | Min height | Min height | Max height | Max height | Avg height | Avg height | Min width | Min width | Max width | Max width |
|---|---|---|---|---|---|---|---|---|---|---|---|---|---|---|
R mask | 9312 | 0.45% | 38.9% | 0% | 1px | 0.13% | 719px | 93.62% | 47px | 6.09% | 1px | 0.13% | 768px | 100% |
C mask | 8837 | 0.72% | 79.33% | 0% | 1px | 0.13% | 768px | 100% | 52px | 6.76% | 1px | 0.13% | 768px | 100% |
U mask | 3330 | 7.4% | 99.95% | 0% | 1px | 0.13% | 768px | 100% | 163px | 21.2% | 1px | 0.13% | 768px | 100% |
J mask | 1489 | 8.63% | 91.54% | 0% | 1px | 0.13% | 768px | 100% | 203px | 26.44% | 1px | 0.13% | 768px | 100% |
Q mask | 893 | 1.37% | 68.14% | 0% | 1px | 0.13% | 568px | 73.96% | 90px | 11.66% | 1px | 0.13% | 713px | 92.84% |
L mask | 776 | 1.83% | 52.69% | 0% | 1px | 0.13% | 623px | 81.12% | 86px | 11.18% | 1px | 0.13% | 558px | 72.66% |
P mask | 667 | 13.41% | 91.86% | 0% | 1px | 0.13% | 768px | 100% | 311px | 40.5% | 2px | 0.26% | 768px | 100% |
IC mask | 603 | 7.18% | 92.32% | 0% | 1px | 0.13% | 768px | 100% | 162px | 21.05% | 1px | 0.13% | 768px | 100% |
D mask | 597 | 0.93% | 6.27% | 0% | 1px | 0.13% | 493px | 64.19% | 87px | 11.34% | 1px | 0.13% | 340px | 44.27% |
RA mask | 542 | 0.58% | 1.6% | 0% | 1px | 0.13% | 123px | 16.02% | 60px | 7.78% | 2px | 0.26% | 130px | 16.93% |
Spatial Heatmap #
The heatmaps below give the spatial distributions of all objects for every class. These visualizations provide insights into the most probable and rare object locations on the image. It helps analyze objects' placements in a dataset.

Objects #
Table contains all 29639 objects. Click a row to preview an image with annotations, and use search or pagination to navigate. Sort columns to find outliers in the dataset.
Object ID ㅤ | Class ㅤ | Image name click row to open | Image size height x width | Height ㅤ | Height ㅤ | Width ㅤ | Width ㅤ | Area ㅤ |
|---|---|---|---|---|---|---|---|---|
1➔ | J mask | image_818.png | 768 x 768 | 610px | 79.43% | 432px | 56.25% | 28.39% |
2➔ | J mask | image_818.png | 768 x 768 | 6px | 0.78% | 2px | 0.26% | 0% |
3➔ | R mask | image_6022.png | 768 x 768 | 47px | 6.12% | 75px | 9.77% | 0.6% |
4➔ | R mask | image_6022.png | 768 x 768 | 10px | 1.3% | 65px | 8.46% | 0.11% |
5➔ | RN mask | image_761.png | 768 x 768 | 59px | 7.68% | 120px | 15.62% | 0.99% |
6➔ | U mask | image_761.png | 768 x 768 | 295px | 38.41% | 192px | 25% | 7.55% |
7➔ | U mask | image_761.png | 768 x 768 | 29px | 3.78% | 17px | 2.21% | 0.07% |
8➔ | U mask | image_761.png | 768 x 768 | 34px | 4.43% | 6px | 0.78% | 0.03% |
9➔ | R mask | image_761.png | 768 x 768 | 54px | 7.03% | 34px | 4.43% | 0.29% |
10➔ | R mask | image_761.png | 768 x 768 | 57px | 7.42% | 35px | 4.56% | 0.31% |
License #
FICS PCB Image CollectionFPIC (FPIC) Component is under CC BY-NC-ND 4.0 license.
Citation #
If you make use of the FPIC-Component data, please cite the following reference:
@article{makwana2023pcbsegclassnet,
  title={PCBSegClassNet—A light-weight network for segmentation and classification of PCB component},
  author={Makwana, Dhruv and Mittal, Sparsh and others},
  journal={Expert Systems with Applications},
  volume={225},
  pages={120029},
  year={2023},
  publisher={Elsevier}
}
If you are happy with Dataset Ninja and use provided visualizations and tools in your work, please cite us:
@misc{ visualization-tools-for-fpic-component-dataset,
  title = { Visualization Tools for FPIC-Component Dataset },
  type = { Computer Vision Tools },
  author = { Dataset Ninja },
  howpublished = { \url{ https://datasetninja.com/fpic-component } },
  url = { https://datasetninja.com/fpic-component },
  journal = { Dataset Ninja },
  publisher = { Dataset Ninja },
  year = { 2026 },
  month = { feb },
  note = { visited on 2026-02-04 },
}
Download #
Dataset FPIC-Component can be downloaded in Supervisely format:
As an alternative, it can be downloaded with dataset-tools package:
pip install --upgrade dataset-tools
… using following python code:
import dataset_tools as dtools

dtools.download(dataset='FPIC-Component', dst_dir='~/dataset-ninja/')
Make sure not to overlook the python code example available on the Supervisely Developer Portal. It will give you a clear idea of how to effortlessly work with the downloaded dataset.
The data in original format can be downloaded here.
Disclaimer #
Our gal from the legal dep told us we need to post this:
Dataset Ninja provides visualizations and statistics for some datasets that can be found online and can be downloaded by general audience. Dataset Ninja is not a dataset hosting platform and can only be used for informational purposes. The platform does not claim any rights for the original content, including images, videos, annotations and descriptions. Joint publishing is prohibited.
You take full responsibility when you use datasets presented at Dataset Ninja, as well as other information, including visualizations and statistics we provide. You are in charge of compliance with any dataset license and all other permissions. You are required to navigate datasets homepage and make sure that you can use it. In case of any questions, get in touch with us at hello@datasetninja.com.


