Introduction #
The authors of the Industrial Optical Inspection dataset present a synthetic benchmark dataset specifically created to identify defects on surfaces with statistical textures. The primary aim is to simplify the process of developing and assessing classification algorithms in the field of industrial optical inspection.
The authors also highlight the competition held at the DAGM 2007 symposium, organized jointly by the DAGM and the GNSS. The competition centred around Weakly Supervised Learning for Industrial Optical Inspection and aimed to address the cost-saving potential of automated optical inspection in industrial quality control. The participants were tasked with designing a classification algorithm meeting specific criteria, such as detecting defects on statistically textured backgrounds, learning from weakly labeled training data, working with data of unknown characteristics, and ensuring automatic parameter adaptation without human intervention.
Regarding the dataset’s description, the authors offer insights into its composition:
- They provide ten datasets, with the first six earmarked for development purposes and the remaining four designated for competition evaluation.
- Each development dataset comprises 1000 ‘non-defective’ and 150 ‘defective’ grayscale 8-bit PNG images. The competition datasets consist of 2000 ‘non-defective’ and 300 ‘defective’ images.
- Different texture and defect models are utilized to generate the datasets.
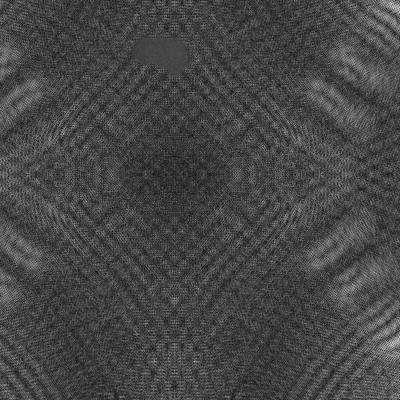
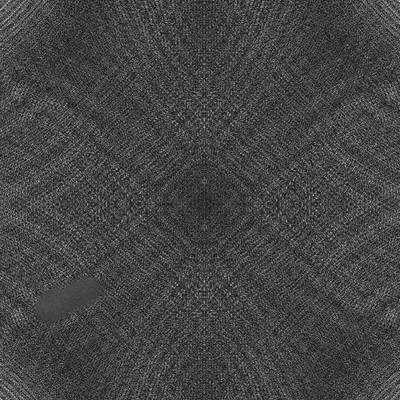
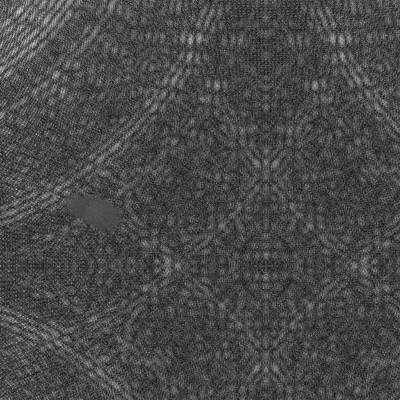
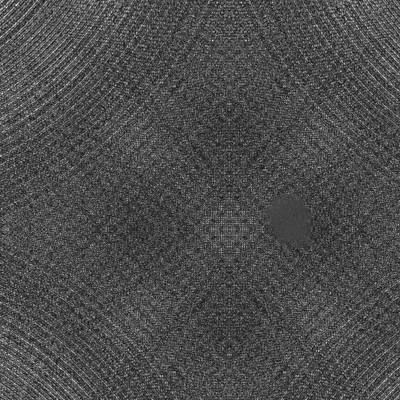
- ‘Non-defective’ images depict the background texture without any defects, while ‘defective’ images feature precisely one labeled defect on the background.
- All datasets are randomly divided into training and testing subsets of equal sizes.
- Weak labels are provided in the form of ellipses that approximately outline the defective area. Technically, these labels are integrated as grayscale 8-bit PNG images stored in a ‘Label’ folder. The background and defective areas are denoted by values 0 and 255, respectively.
The authors emphasize the significance of maintaining a code of honour during the dataset’s usage, suggesting that researchers should refrain from analyzing or utilizing the competition datasets until the development phase is completed. This approach ensures fairness and integrity in evaluating the algorithms.
Summary #
Weakly Supervised Learning for Industrial Optical Inspection is a dataset for instance segmentation, semantic segmentation, and object detection tasks. It is used in the industrial and computer aided quality control domains.
The dataset consists of 16100 images with 2120 labeled objects belonging to 1 single class (defect).
Images in the Industrial Optical Inspection dataset have pixel-level instance segmentation annotations. Due to the nature of the instance segmentation task, it can be automatically transformed into a semantic segmentation (only one mask for every class) or object detection (bounding boxes for every object) tasks. There are 14000 (87% of the total) unlabeled images (i.e. without annotations). There are 20 splits in the dataset: Class7-Test (1150 images), Class8-Test (1150 images), Class9-Train (1150 images), Class9-Test (1150 images), Class7-Train (1150 images), Class8-Train (1150 images), Class10-Test (1150 images), Class10-Train (1150 images), Class1-Train (575 images), Class1-Test (575 images), Class3-Train (575 images), Class4-Test (575 images), Class2-Train (575 images), Class3-Test (575 images), Class5-Train (575 images), Class5-Test (575 images), Class2-Test (575 images), Class4-Train (575 images), Class6-Test (575 images), and Class6-Train (575 images). The dataset was released in 2007 by the Bosch Research, Germany.
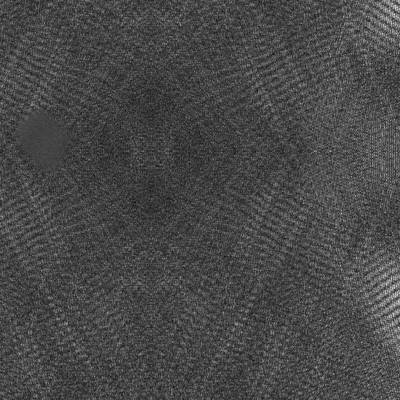
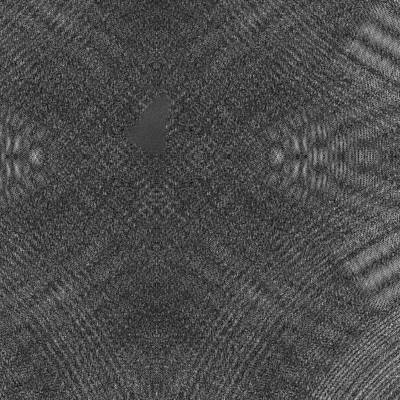
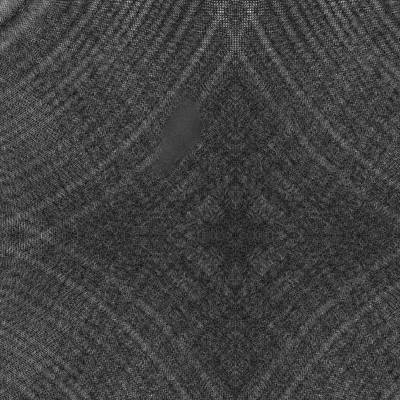
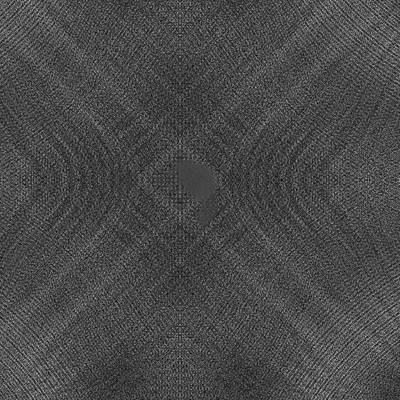
Here is the visualized example grid with animated annotations:
Explore #
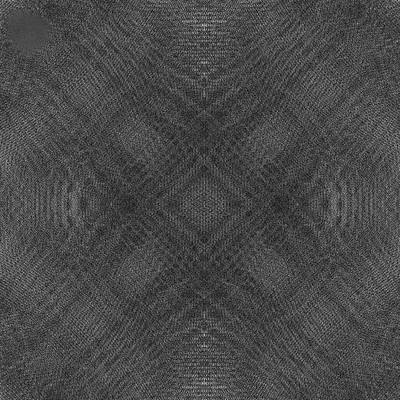
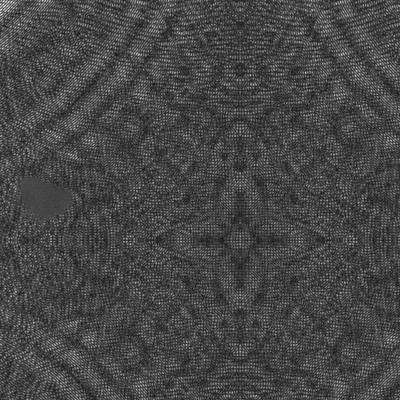
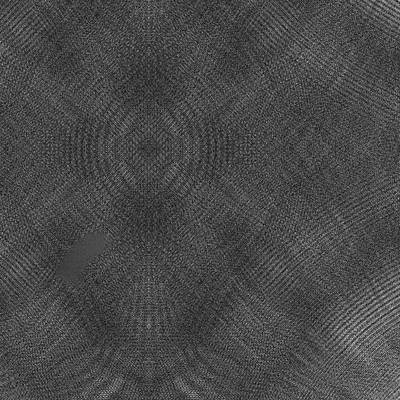
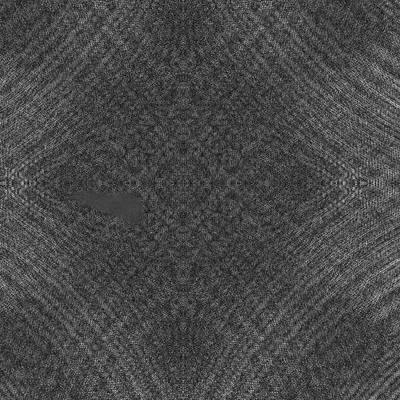
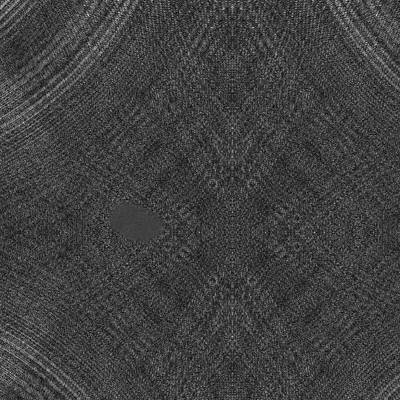
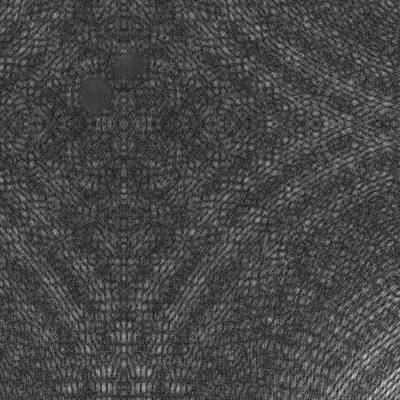
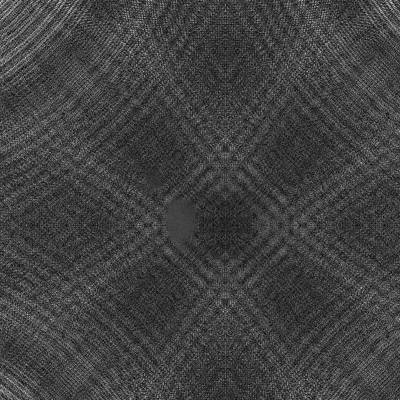
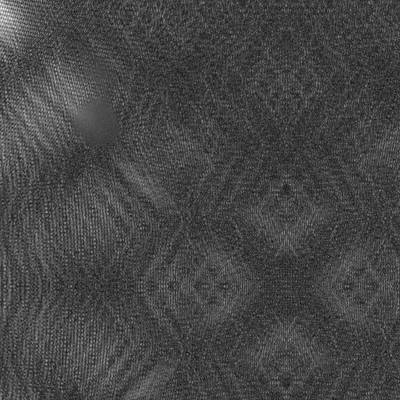
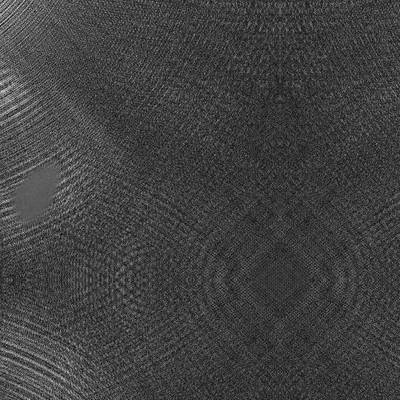
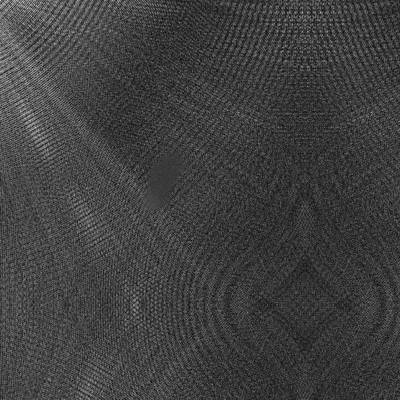
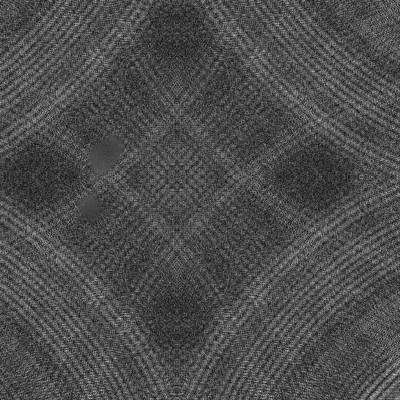
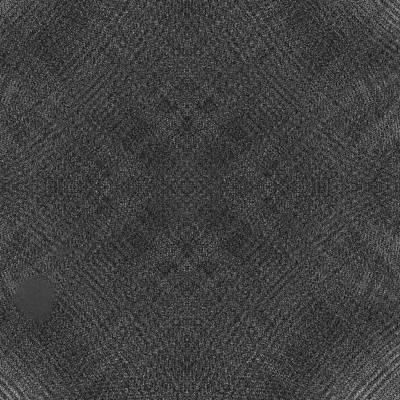
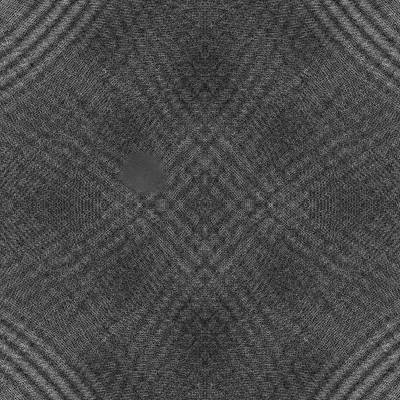
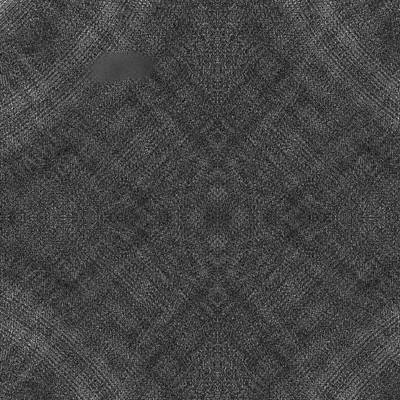
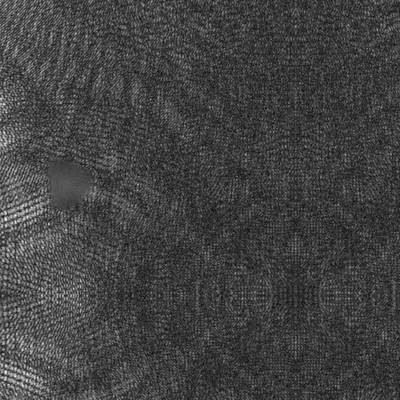
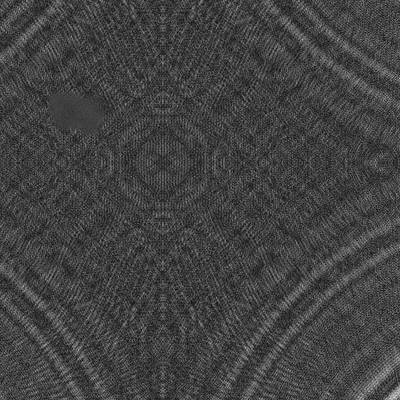
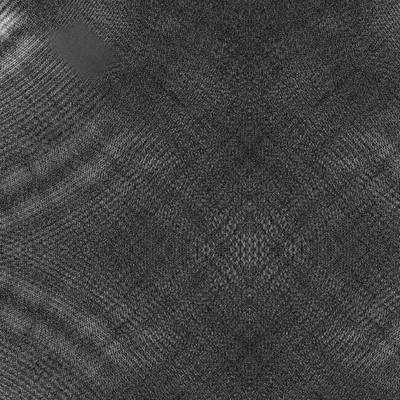
Industrial Optical Inspection dataset has 16100 images. Click on one of the examples below or open "Explore" tool anytime you need to view dataset images with annotations. This tool has extended visualization capabilities like zoom, translation, objects table, custom filters and more. Hover the mouse over the images to hide or show annotations.


































Class balance #
There are 1 annotation classes in the dataset. Find the general statistics and balances for every class in the table below. Click any row to preview images that have labels of the selected class. Sort by column to find the most rare or prevalent classes.
Class ㅤ | Images ㅤ | Objects ㅤ | Count on image average | Area on image average |
|---|---|---|---|---|
defect➔ mask | 2100 | 2120 | 1.01 | 2.21% |
Images #
Explore every single image in the dataset with respect to the number of annotations of each class it has. Click a row to preview selected image. Sort by any column to find anomalies and edge cases. Use horizontal scroll if the table has many columns for a large number of classes in the dataset.
Object distribution #
Interactive heatmap chart for every class with object distribution shows how many images are in the dataset with a certain number of objects of a specific class. Users can click cell and see the list of all corresponding images.
Class sizes #
The table below gives various size properties of objects for every class. Click a row to see the image with annotations of the selected class. Sort columns to find classes with the smallest or largest objects or understand the size differences between classes.
Class | Object count | Avg area | Max area | Min area | Min height | Min height | Max height | Max height | Avg height | Avg height | Min width | Min width | Max width | Max width |
|---|---|---|---|---|---|---|---|---|---|---|---|---|---|---|
defect mask | 2120 | 2.19% | 12.23% | 0% | 1px | 0.2% | 499px | 97.46% | 87px | 16.95% | 1px | 0.2% | 511px | 99.8% |
Spatial Heatmap #
The heatmaps below give the spatial distributions of all objects for every class. These visualizations provide insights into the most probable and rare object locations on the image. It helps analyze objects' placements in a dataset.

Objects #
Table contains all 2120 objects. Click a row to preview an image with annotations, and use search or pagination to navigate. Sort columns to find outliers in the dataset.
Object ID ㅤ | Class ㅤ | Image name click row to open | Image size height x width | Height ㅤ | Height ㅤ | Width ㅤ | Width ㅤ | Area ㅤ |
|---|---|---|---|---|---|---|---|---|
1➔ | defect mask | 0681.PNG | 512 x 512 | 65px | 12.7% | 137px | 26.76% | 0.86% |
2➔ | defect mask | 1830.PNG | 512 x 512 | 21px | 4.1% | 151px | 29.49% | 0.96% |
3➔ | defect mask | 0869.PNG | 512 x 512 | 45px | 8.79% | 79px | 15.43% | 0.58% |
4➔ | defect mask | 2107.PNG | 512 x 512 | 79px | 15.43% | 109px | 21.29% | 0.86% |
5➔ | defect mask | 0469.PNG | 512 x 512 | 87px | 16.99% | 111px | 21.68% | 0.97% |
6➔ | defect mask | 2050.PNG | 512 x 512 | 141px | 27.54% | 159px | 31.05% | 1.25% |
7➔ | defect mask | 1198.PNG | 512 x 512 | 69px | 13.48% | 125px | 24.41% | 1.03% |
8➔ | defect mask | 1076.PNG | 512 x 512 | 47px | 9.18% | 101px | 19.73% | 1% |
9➔ | defect mask | 1807.PNG | 512 x 512 | 59px | 11.52% | 111px | 21.68% | 1.96% |
10➔ | defect mask | 1029.PNG | 512 x 512 | 37px | 7.23% | 129px | 25.2% | 0.79% |
License #
Citation #
If you make use of the Industrial Optical Inspection data, please cite the following reference:
@dataset{wieler_matthias_2007_8086136,
  author       = {Wieler, Matthias and
                  Hahn, Tobias and
                  Hamprecht, Fred A.},
  title        = {{Weakly Supervised Learning for Industrial Optical
                   Inspection}},
  month        = sep,
  year         = 2007,
  note         = {{Acknowledgements The data was created by Matthias
                   Wieler and Tobias Hahn. This work was conducted at
                   the Robert Bosch Corporate Research department,
                   Schwieberdingen, Germany. We also thank the
                   participants in the contest, the participants of
                   the symposium who helped finance the competition
                   with their registration fees and the GNNS (German
                   Chapter of the European Neural Network Society)
                   for sponsoring the competition.}},
  publisher    = {Zenodo},
  doi          = {10.5281/zenodo.8086136},
  url          = {https://doi.org/10.5281/zenodo.8086136}
}
If you are happy with Dataset Ninja and use provided visualizations and tools in your work, please cite us:
@misc{ visualization-tools-for-industrial-optical-inspection-dataset,
  title = { Visualization Tools for Industrial Optical Inspection Dataset },
  type = { Computer Vision Tools },
  author = { Dataset Ninja },
  howpublished = { \url{ https://datasetninja.com/industrial-optical-inspection } },
  url = { https://datasetninja.com/industrial-optical-inspection },
  journal = { Dataset Ninja },
  publisher = { Dataset Ninja },
  year = { 2026 },
  month = { feb },
  note = { visited on 2026-02-04 },
}
Download #
Dataset Industrial Optical Inspection can be downloaded in Supervisely format:
As an alternative, it can be downloaded with dataset-tools package:
pip install --upgrade dataset-tools
… using following python code:
import dataset_tools as dtools

dtools.download(dataset='Industrial Optical Inspection', dst_dir='~/dataset-ninja/')
Make sure not to overlook the python code example available on the Supervisely Developer Portal. It will give you a clear idea of how to effortlessly work with the downloaded dataset.
The data in original format can be downloaded here:
Disclaimer #
Our gal from the legal dep told us we need to post this:
Dataset Ninja provides visualizations and statistics for some datasets that can be found online and can be downloaded by general audience. Dataset Ninja is not a dataset hosting platform and can only be used for informational purposes. The platform does not claim any rights for the original content, including images, videos, annotations and descriptions. Joint publishing is prohibited.
You take full responsibility when you use datasets presented at Dataset Ninja, as well as other information, including visualizations and statistics we provide. You are in charge of compliance with any dataset license and all other permissions. You are required to navigate datasets homepage and make sure that you can use it. In case of any questions, get in touch with us at hello@datasetninja.com.


