Introduction #
The authors collected and annotated a new MJU-Waste Dataset v1.0 for waste object segmentation. It is the largest public benchmark available for waste object segmentation, with 1485 images for training, 248 for validation and 742 for testing. For each color image, the authors provide the co-registered depth image captured using an RGBD camera. The authors manually labeled each of the images.
Note, similar MJU-Waste Dataset v1.0 dataset is also available on the DatasetNinja.com:
Motivation
Waste objects are ubiquitous in both indoor and outdoor settings, spanning household, office, and road environments. Consequently, it’s imperative for vision-based intelligent robots to effectively locate and interact with them. However, the task of detecting and segmenting waste objects poses unique challenges compared to other objects. These items may be incomplete, damaged, or both, making their identification more complex. Often, their presence can only be inferred from contextual clues within the scene, such as their contrast against the background or their intended use.
Furthermore, accurately localizing waste objects is hindered by significant scale variations due to their diverse physical sizes and dynamic perspectives. The sheer volume of small objects exacerbates this challenge, making it difficult even for humans to precisely delineate their boundaries without zooming in for a closer look. Unlike robots, the human visual system possesses the ability to adjust attention across a wide or narrow visual field, enabling us to quickly grasp the scene’s meaning and identify objects of interest. This capability allows us to focus on specific object regions for detailed examination and fine-grained delineation.
Example images from MJU-Waste and TACO datasets and their zoomed-in object regions. Detecting and localizing waste objects require both scene level and object level reasoning.
Dataset description
Given an input color image and optionally an additional depth image, the authors model outputs a pixelwise labeling map. They apply deep models at both the scene and the object levels.
Overview of the proposed method. Given an input image, the authors approach the waste object segmentation problem at three levels: (i) scene-level parsing for an initial coarse segmentation, (ii) object-level parsing to recover fine details for each object region proposal, and (iii) pixel-level refinement based on color, depth, and spatial affinities. Together, joint inference at all these levels produces coherent final segmentation results.
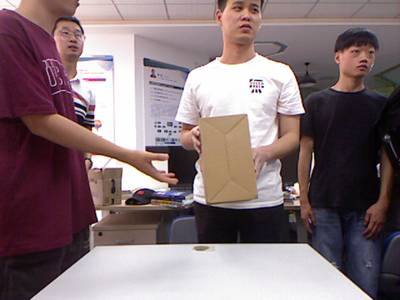
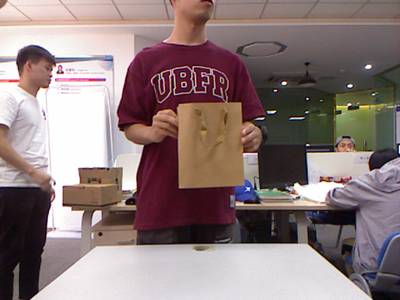
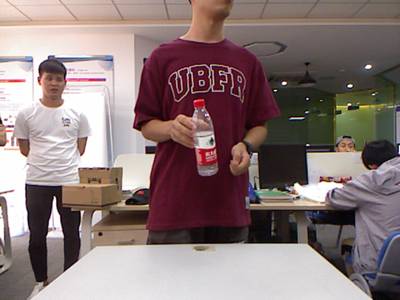
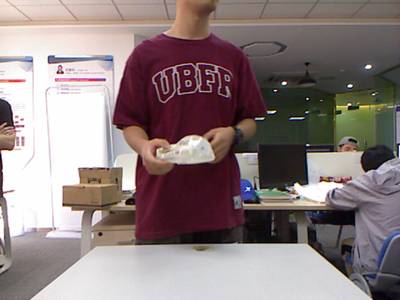
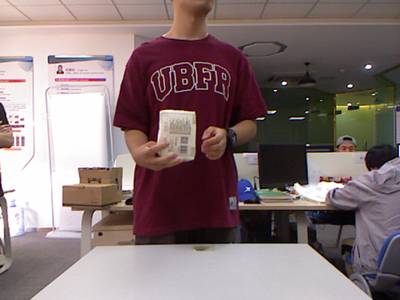
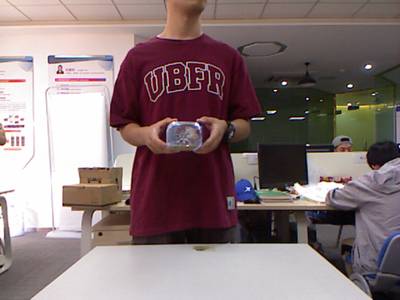
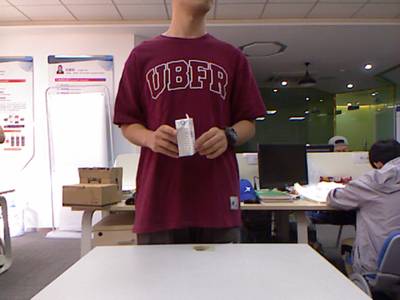
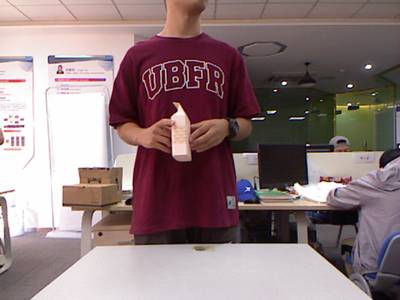
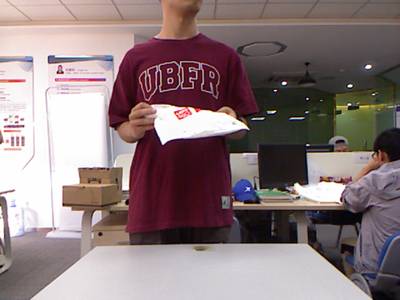
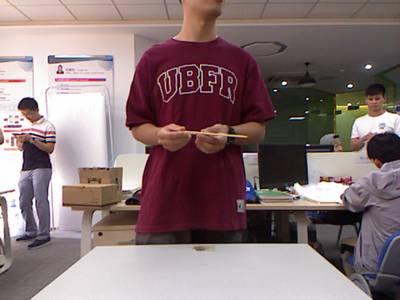
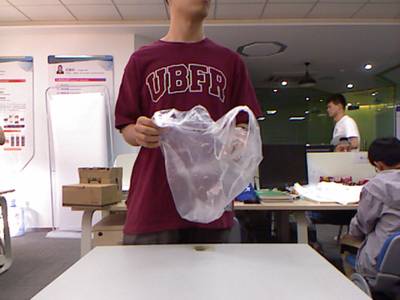
The dataset was curated by the authors through a process involving the collection of waste items from a university campus, subsequent transportation to a lab, and the capturing of images depicting individuals holding these waste items. All images within the dataset were acquired using a Microsoft Kinect RGBD camera. The current iteration of the dataset, known as MJU-Waste, comprises 2475 co-registered pairs of RGB and depth images.
To organize the dataset, the authors partitioned the images randomly into three subsets: a training set, a validation set, and a test set, consisting of 1485, 248, and 742 images, respectively. However, due to inherent limitations of the sensor, the depth frames may contain missing values, particularly at reflective surfaces, occlusion boundaries, and distant regions. To address this, a median filter is employed to fill in these missing values, ensuring the depth images maintain high quality. Furthermore, each image within the MJU-Waste dataset is meticulously annotated with a pixelwise mask delineating the waste objects present.
Example color frames, ground-truth annotations, and depth frames from the MJU-Waste dataset. Ground-truth masks are shown in blue. Missing values in the raw depth frames are shown in white. These values are filled in with a median filter following.
Summary #
MJU-Waste Dataset v1.0 is a dataset for instance segmentation, semantic segmentation, object detection, and monocular depth estimation tasks. It is used in the waste recycling and robotics industries.
The dataset consists of 4950 images with 5026 labeled objects belonging to 1 single class (waste).
Images in the MJU-Waste dataset have pixel-level instance segmentation annotations. Due to the nature of the instance segmentation task, it can be automatically transformed into a semantic segmentation (only one mask for every class) or object detection (bounding boxes for every object) tasks. There are 16 (0% of the total) unlabeled images (i.e. without annotations). There are 3 splits in the dataset: train (2970 images), test (1484 images), and val (496 images). Additionally, images are grouped by im_id. The dataset was released in 2020 by the Fujian Provincial Key Laboratory of Information Processing and Intelligent Control, China, College of Mathematics and Computer Science, China, NetDragon Inc., China, and School of Electronic and Information Engineering, China.

Explore #
MJU-Waste dataset has 4950 images. Click on one of the examples below or open "Explore" tool anytime you need to view dataset images with annotations. This tool has extended visualization capabilities like zoom, translation, objects table, custom filters and more. Hover the mouse over the images to hide or show annotations.



























Class balance #
There are 1 annotation classes in the dataset. Find the general statistics and balances for every class in the table below. Click any row to preview images that have labels of the selected class. Sort by column to find the most rare or prevalent classes.
Class ㅤ | Images ㅤ | Objects ㅤ | Count on image average | Area on image average |
|---|---|---|---|---|
waste➔ mask | 4934 | 5026 | 1.02 | 1.94% |
Images #
Explore every single image in the dataset with respect to the number of annotations of each class it has. Click a row to preview selected image. Sort by any column to find anomalies and edge cases. Use horizontal scroll if the table has many columns for a large number of classes in the dataset.
Object distribution #
Interactive heatmap chart for every class with object distribution shows how many images are in the dataset with a certain number of objects of a specific class. Users can click cell and see the list of all corresponding images.
Class sizes #
The table below gives various size properties of objects for every class. Click a row to see the image with annotations of the selected class. Sort columns to find classes with the smallest or largest objects or understand the size differences between classes.
Class | Object count | Avg area | Max area | Min area | Min height | Min height | Max height | Max height | Avg height | Avg height | Min width | Min width | Max width | Max width |
|---|---|---|---|---|---|---|---|---|---|---|---|---|---|---|
waste mask | 5026 | 1.91% | 17.8% | 0.02% | 10px | 2.08% | 454px | 94.58% | 91px | 18.88% | 8px | 1.25% | 380px | 59.38% |
Spatial Heatmap #
The heatmaps below give the spatial distributions of all objects for every class. These visualizations provide insights into the most probable and rare object locations on the image. It helps analyze objects' placements in a dataset.

Objects #
Table contains all 5026 objects. Click a row to preview an image with annotations, and use search or pagination to navigate. Sort columns to find outliers in the dataset.
Object ID ㅤ | Class ㅤ | Image name click row to open | Image size height x width | Height ㅤ | Height ㅤ | Width ㅤ | Width ㅤ | Area ㅤ |
|---|---|---|---|---|---|---|---|---|
1➔ | waste mask | 2020-01-07_16_13_45-29_color.png | 480 x 640 | 139px | 28.96% | 125px | 19.53% | 2.88% |
2➔ | waste mask | 2019-09-19_16_25_09-02_color.png | 480 x 640 | 61px | 12.71% | 38px | 5.94% | 0.62% |
3➔ | waste mask | 2020-01-07_17_25_56-75_color.png | 480 x 640 | 114px | 23.75% | 153px | 23.91% | 4.84% |
4➔ | waste mask | 2019-09-24_16_37_09-25_color.png | 480 x 640 | 138px | 28.75% | 82px | 12.81% | 1.48% |
5➔ | waste mask | 2019-12-10_16_42_02-39_color.png | 480 x 640 | 119px | 24.79% | 110px | 17.19% | 3.04% |
6➔ | waste mask | 2019-12-10_16_42_00-21_depth.png | 480 x 640 | 108px | 22.5% | 103px | 16.09% | 2.07% |
7➔ | waste mask | 2020-01-07_17_00_47-56_color.png | 480 x 640 | 66px | 13.75% | 70px | 10.94% | 0.62% |
8➔ | waste mask | 2019-09-19_16_39_16-85_color.png | 480 x 640 | 156px | 32.5% | 126px | 19.69% | 4.65% |
9➔ | waste mask | 2020-01-07_16_43_45-20_color.png | 480 x 640 | 53px | 11.04% | 53px | 8.28% | 0.37% |
10➔ | waste mask | 2020-01-07_17_00_12-44_color.png | 480 x 640 | 54px | 11.25% | 124px | 19.38% | 1.16% |
License #
Citation #
If you make use of the MJU-Waste data, please cite the following reference:
@article{wang2020multi,
  title={A Multi-Level Approach to Waste Object Segmentation},
  author={Wang, Tao and Cai, Yuanzheng and Liang, Lingyu and Ye, Dongyi},
  journal={Sensors},
  year={2020}
}
If you are happy with Dataset Ninja and use provided visualizations and tools in your work, please cite us:
@misc{ visualization-tools-for-mju-waste-dataset,
  title = { Visualization Tools for MJU-Waste Dataset },
  type = { Computer Vision Tools },
  author = { Dataset Ninja },
  howpublished = { \url{ https://datasetninja.com/mju-waste } },
  url = { https://datasetninja.com/mju-waste },
  journal = { Dataset Ninja },
  publisher = { Dataset Ninja },
  year = { 2026 },
  month = { feb },
  note = { visited on 2026-02-22 },
}
Download #
Dataset MJU-Waste can be downloaded in Supervisely format:
As an alternative, it can be downloaded with dataset-tools package:
pip install --upgrade dataset-tools
… using following python code:
import dataset_tools as dtools

dtools.download(dataset='MJU-Waste', dst_dir='~/dataset-ninja/')
Make sure not to overlook the python code example available on the Supervisely Developer Portal. It will give you a clear idea of how to effortlessly work with the downloaded dataset.
The data in original format can be downloaded here.
Disclaimer #
Our gal from the legal dep told us we need to post this:
Dataset Ninja provides visualizations and statistics for some datasets that can be found online and can be downloaded by general audience. Dataset Ninja is not a dataset hosting platform and can only be used for informational purposes. The platform does not claim any rights for the original content, including images, videos, annotations and descriptions. Joint publishing is prohibited.
You take full responsibility when you use datasets presented at Dataset Ninja, as well as other information, including visualizations and statistics we provide. You are in charge of compliance with any dataset license and all other permissions. You are required to navigate datasets homepage and make sure that you can use it. In case of any questions, get in touch with us at hello@datasetninja.com.


