Introduction #
The Plastic Bottles dataset is designed to introduce a model prototype for identifying plastic objects in rivers. Importantly, this model is optimized for deployment on resource-constrained devices that operate without an internet connection. The authors mention that the role of rivers in transporting plastic waste, a crucial aspect of global plastic pollution, has not received sufficient attention in research.
Current estimates of plastic emissions from rivers primarily rely on mathematical models that take into account factors like the size and development level of cities located near the river. However, these estimates lack granularity, offering only a monthly assessment for entire rivers or cities. This limited granularity often leads to a lack of actionable insights because the most environmentally harmful rivers are frequently lengthy, making it challenging to pinpoint precise intervention areas. Additionally, this data is often statistically inferred rather than directly measured in the real world, representing what is assumed to be realistic rather than what truly exists.
The instructions for the photographers were:
- Always point the camera at a 90-degree angle relative to the river
- Try to photograph a little bit from above
- Do not use the zoom of their camera
- Take a lot of pictures in different places (at least 50x pictures in each place, wait at least 5 seconds between two pictures).
- In general, don’t wait for the perfect shot, but take many (hundreds).
- Try to take pictures at different times in the same location (e.g.: after sunset, around noon, afternoon etc.)
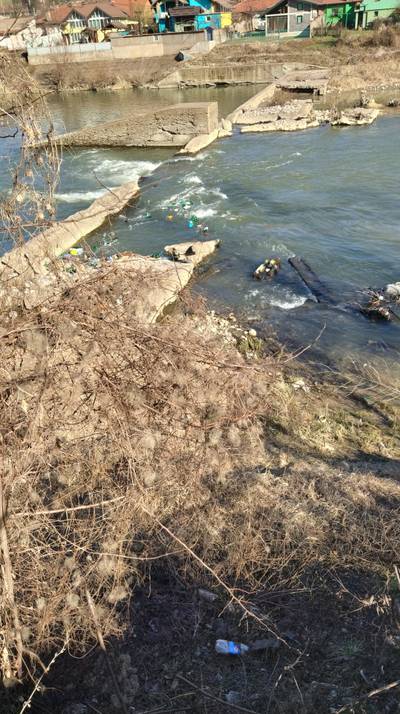
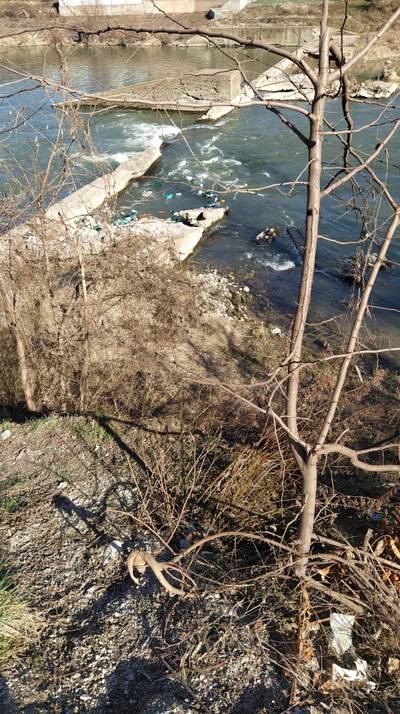
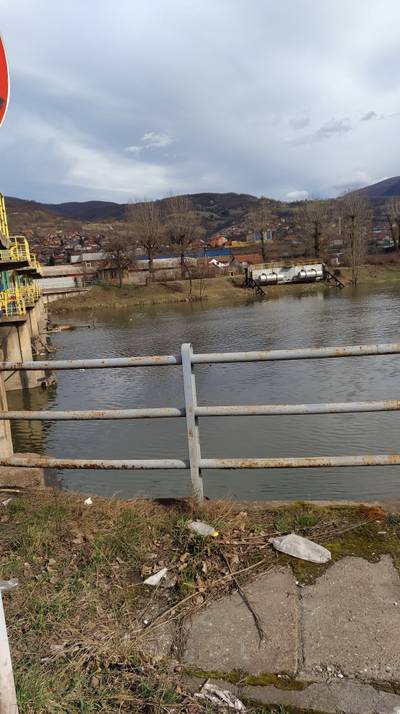
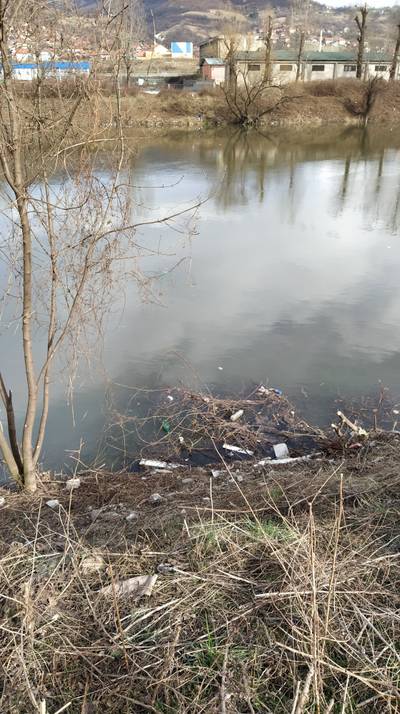
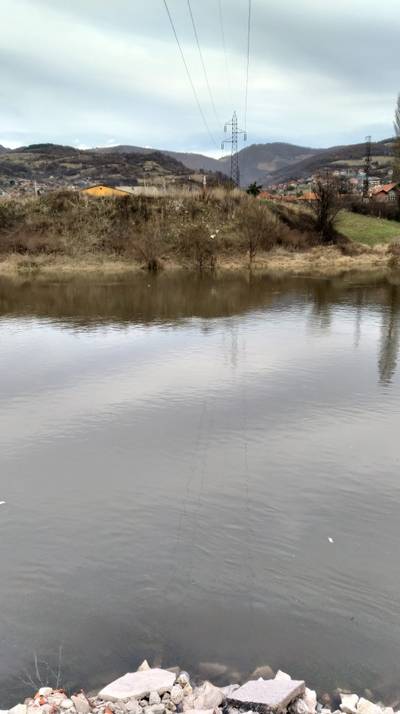
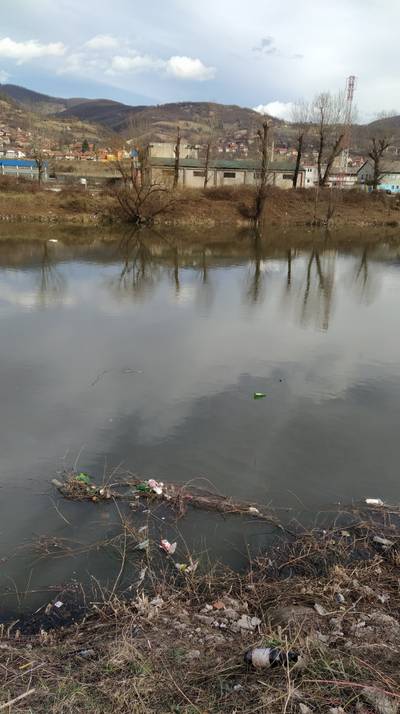
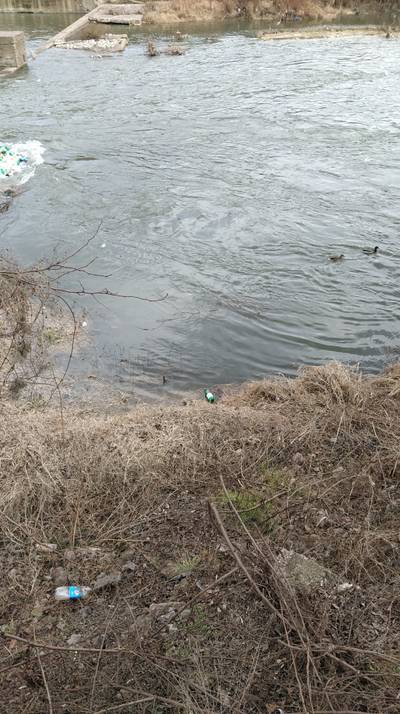
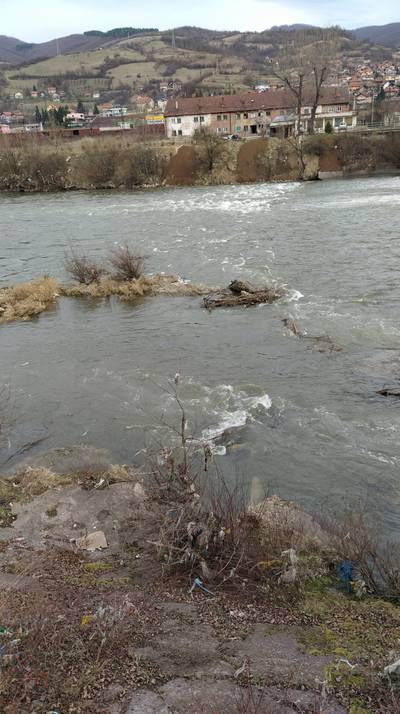
During the data gathering, the photographers were given examples of good and bad images from the pool they sent in and edge cases were discussed. The data-gathering / picture-taking process took roughly two months of work. Pictures were mostly taken from the side of a river. This means, for example, that the dataset may be less suitable for e.g. aerial surveillance.
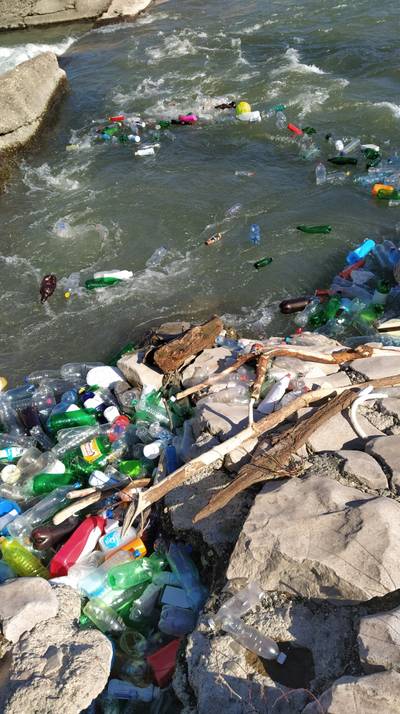
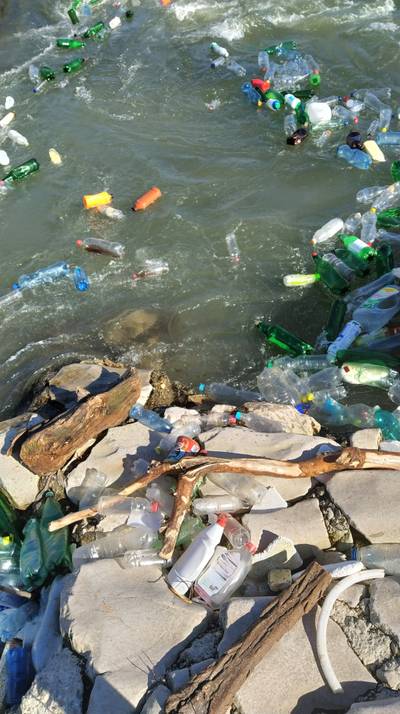
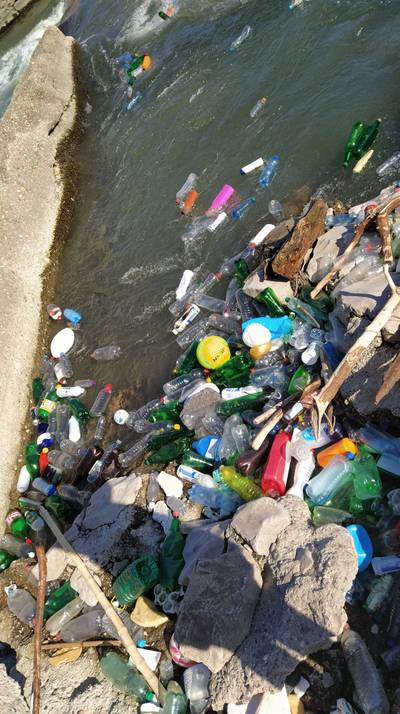
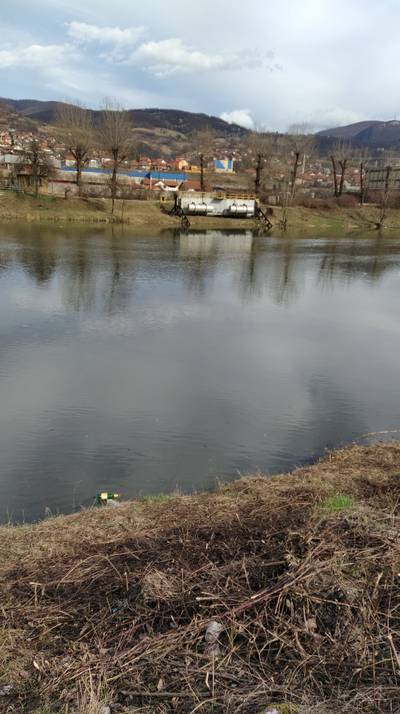
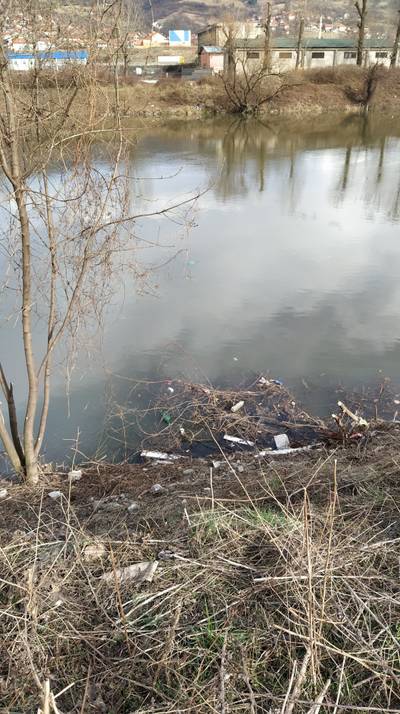
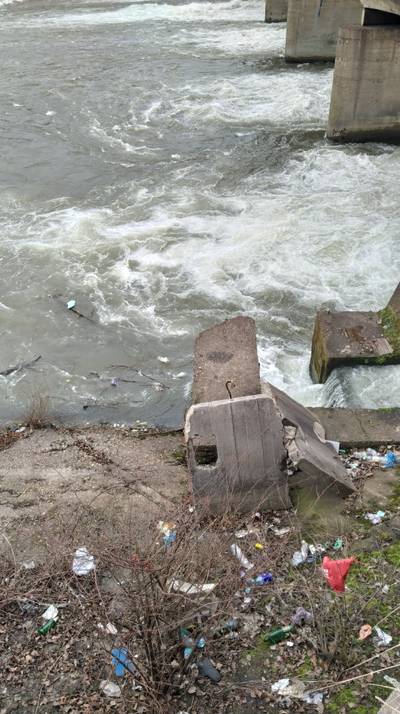
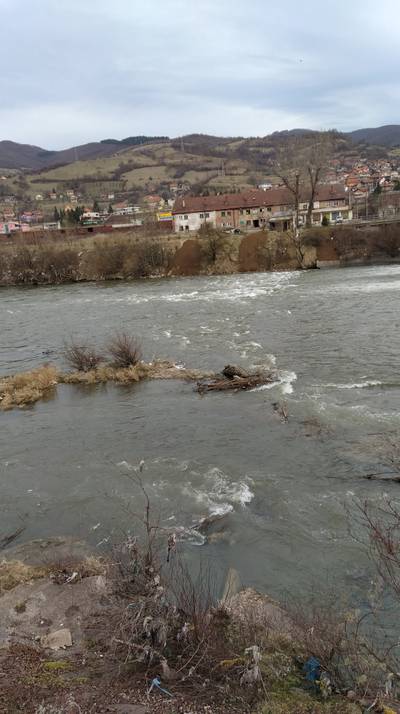
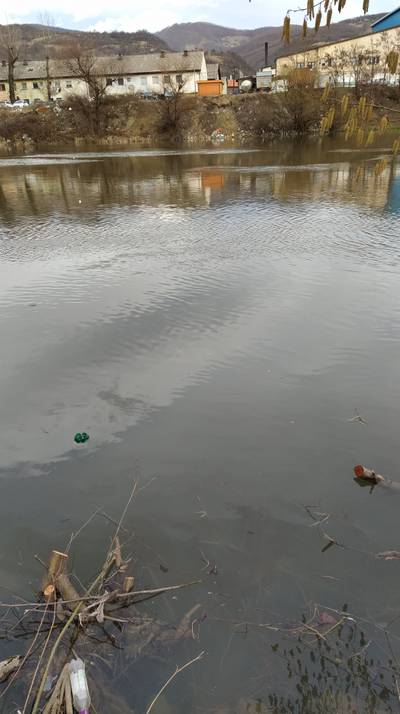
No images were taken during nighttime or during bad weather conditions. While some variance in the time of day naturally occurred, all images were taken during daylight. Camera zoom was intentionally not used in order to cover a large variety of distances. This means, that there are a significant number of images where the plastic bottle is very far away and may only be visible upon a close look and/or using zoom. The author of the dataset hopes to increase the odds that a machine learning system can detect these as well, enabling surveillance of larger rivers. He estimates the bottles farthest away in the dataset have a distance of about 50-60 meters from the camera. At this point, even with zoom, a human has problems classifying the object in the picture – it is still clearly distinct from the water surface, but not easily separable e.g. from a bird. The variety of their dataset means there is also a lot of variance in the number of bottles represented in an image.
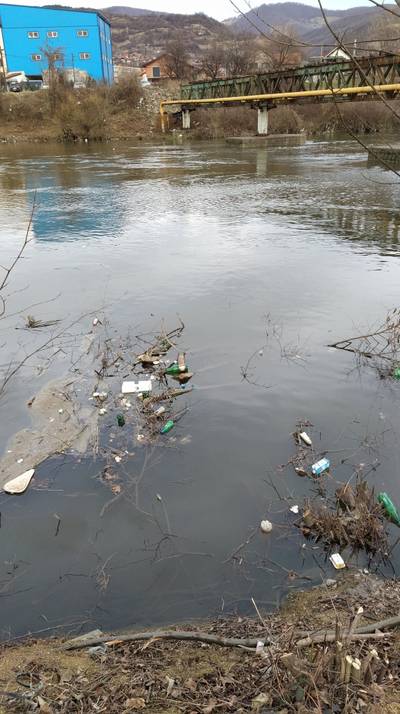
There are images of bottles swimming freely as well as bottles that are relatively stationary. All bottles are photographed either on river water or on other pollution objects, including more bottles. No bottles have been photographed on land. The images were taken with different devices, both mobile phones and cameras. Due to this, the images generally have different resolutions. No tripod has been used for any pictures and the height from which the pictures were taken may vary slightly as well as the angle of the camera.
| Attribute | Value |
|---|---|
| Total images: | 989 (some duplicate images were removed) |
| Avg. bottles per image: | 5.6 |
| Image format | JPG |
| Total image file size: | 2.6 GB |
| Photographed in: | 34 Sessions |
| Countries of rivers: | Bangladesh, Bosnia, India, Indonesia, Nepal, Pakistan, Sudan |
| Camera perspective: | Side of the river (mostly) |
| Labeling format: | Pascal |
| License: | Public Domain |
Summary #
Plastic Bottles in Rivers is a dataset for an object detection task. Possible applications of the dataset could be in the environmental domain.
The dataset consists of 989 images with 5534 labeled objects belonging to 1 single class (plastic bottle).
Images in the Plastic Bottles dataset have bounding box annotations. There is 1 unlabeled image (i.e. without annotations). There are no pre-defined train/val/test splits in the dataset. The dataset was released in 2020.

Explore #
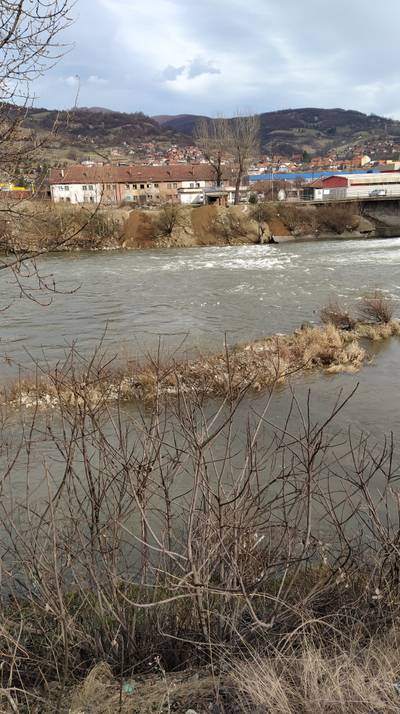
Plastic Bottles dataset has 989 images. Click on one of the examples below or open "Explore" tool anytime you need to view dataset images with annotations. This tool has extended visualization capabilities like zoom, translation, objects table, custom filters and more. Hover the mouse over the images to hide or show annotations.




























Class balance #
There are 1 annotation classes in the dataset. Find the general statistics and balances for every class in the table below. Click any row to preview images that have labels of the selected class. Sort by column to find the most rare or prevalent classes.
Class ㅤ | Images ㅤ | Objects ㅤ | Count on image average | Area on image average |
|---|---|---|---|---|
plastic bottle➔ rectangle | 988 | 5534 | 5.6 | 0.68% |
Images #
Explore every single image in the dataset with respect to the number of annotations of each class it has. Click a row to preview selected image. Sort by any column to find anomalies and edge cases. Use horizontal scroll if the table has many columns for a large number of classes in the dataset.
Class sizes #
The table below gives various size properties of objects for every class. Click a row to see the image with annotations of the selected class. Sort columns to find classes with the smallest or largest objects or understand the size differences between classes.
Class | Object count | Avg area | Max area | Min area | Min height | Min height | Max height | Max height | Avg height | Avg height | Min width | Min width | Max width | Max width |
|---|---|---|---|---|---|---|---|---|---|---|---|---|---|---|
plastic bottle rectangle | 5534 | 0.13% | 9.83% | 0% | 3px | 0.07% | 933px | 38.61% | 63px | 2.24% | 3px | 0.1% | 1264px | 42.13% |
Spatial Heatmap #
The heatmaps below give the spatial distributions of all objects for every class. These visualizations provide insights into the most probable and rare object locations on the image. It helps analyze objects' placements in a dataset.

Objects #
Table contains all 5534 objects. Click a row to preview an image with annotations, and use search or pagination to navigate. Sort columns to find outliers in the dataset.
Object ID ㅤ | Class ㅤ | Image name click row to open | Image size height x width | Height ㅤ | Height ㅤ | Width ㅤ | Width ㅤ | Area ㅤ |
|---|---|---|---|---|---|---|---|---|
1➔ | plastic bottle rectangle | IMG_20200307_140536.jpg | 2248 x 4000 | 4px | 0.18% | 14px | 0.35% | 0% |
2➔ | plastic bottle rectangle | IMG_20200307_140536.jpg | 2248 x 4000 | 9px | 0.4% | 19px | 0.47% | 0% |
3➔ | plastic bottle rectangle | IMG_20200307_140536.jpg | 2248 x 4000 | 21px | 0.93% | 22px | 0.55% | 0.01% |
4➔ | plastic bottle rectangle | IMG_20200307_140536.jpg | 2248 x 4000 | 15px | 0.67% | 25px | 0.62% | 0% |
5➔ | plastic bottle rectangle | IMG_20200307_140536.jpg | 2248 x 4000 | 8px | 0.36% | 13px | 0.33% | 0% |
6➔ | plastic bottle rectangle | IMG_20200307_140536.jpg | 2248 x 4000 | 7px | 0.31% | 8px | 0.2% | 0% |
7➔ | plastic bottle rectangle | IMG_20200307_140536.jpg | 2248 x 4000 | 7px | 0.31% | 7px | 0.17% | 0% |
8➔ | plastic bottle rectangle | IMG_20200307_140536.jpg | 2248 x 4000 | 7px | 0.31% | 10px | 0.25% | 0% |
9➔ | plastic bottle rectangle | IMG_20200223_132743.jpg | 2248 x 4000 | 233px | 10.36% | 82px | 2.05% | 0.21% |
10➔ | plastic bottle rectangle | IMG_20200223_132743.jpg | 2248 x 4000 | 272px | 12.1% | 336px | 8.4% | 1.02% |
License #
Citation #
If you make use of the Plastic Bottles data, please cite the following reference:
@dataset{Plastic Bottles,
	author={m0-n},
	title={5592 Plastic Bottles in Rivers Dataset},
	year={2020},
	url={https://github.com/m0-n/Plastic-Bottles-Dataset}
}
If you are happy with Dataset Ninja and use provided visualizations and tools in your work, please cite us:
@misc{ visualization-tools-for-plastic-bottles-dataset,
  title = { Visualization Tools for Plastic Bottles Dataset },
  type = { Computer Vision Tools },
  author = { Dataset Ninja },
  howpublished = { \url{ https://datasetninja.com/plastic-bottles } },
  url = { https://datasetninja.com/plastic-bottles },
  journal = { Dataset Ninja },
  publisher = { Dataset Ninja },
  year = { 2026 },
  month = { feb },
  note = { visited on 2026-02-22 },
}
Download #
Dataset Plastic Bottles can be downloaded in Supervisely format:
As an alternative, it can be downloaded with dataset-tools package:
pip install --upgrade dataset-tools
… using following python code:
import dataset_tools as dtools

dtools.download(dataset='Plastic Bottles', dst_dir='~/dataset-ninja/')
Make sure not to overlook the python code example available on the Supervisely Developer Portal. It will give you a clear idea of how to effortlessly work with the downloaded dataset.
The data in original format can be downloaded here.
Disclaimer #
Our gal from the legal dep told us we need to post this:
Dataset Ninja provides visualizations and statistics for some datasets that can be found online and can be downloaded by general audience. Dataset Ninja is not a dataset hosting platform and can only be used for informational purposes. The platform does not claim any rights for the original content, including images, videos, annotations and descriptions. Joint publishing is prohibited.
You take full responsibility when you use datasets presented at Dataset Ninja, as well as other information, including visualizations and statistics we provide. You are in charge of compliance with any dataset license and all other permissions. You are required to navigate datasets homepage and make sure that you can use it. In case of any questions, get in touch with us at hello@datasetninja.com.


