Introduction #
The authors of the SARAS-ESAD 2020 dataset have compiled a collection of data, referred to as the ESAD (Expert Surgical Actions Detection) dataset, to address the challenges involved in Minimally Invasive Surgery (MIS). The success of MIS depends on the proficiency of human surgeons and the efficiency of their coordination. To introduce more automation in MIS, the authors’ SARAS consortium is working on the Smart Autonomous Robotic Assistant Surgeon (SARAS) project, aiming to replace the assistant surgeon with two assistive robotic arms. For this purpose, an artificial intelligence-based system is needed to understand the surgical scene, detect the actions performed by the main surgeon, and provide cues for the autonomous assistant surgeon. To create such a system, the SARAS endoscopic vision challenge for surgeon action detection was held in 2020.
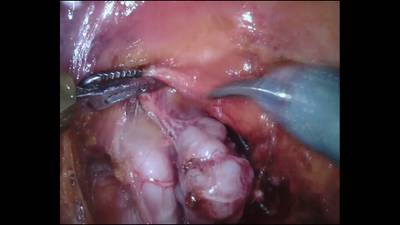
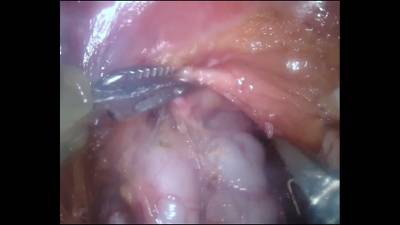
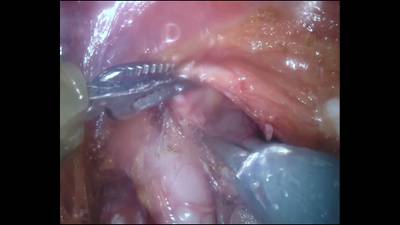
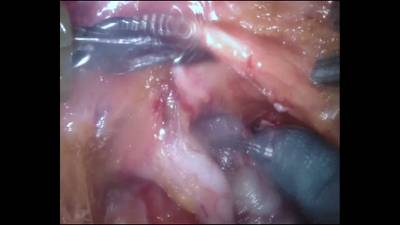
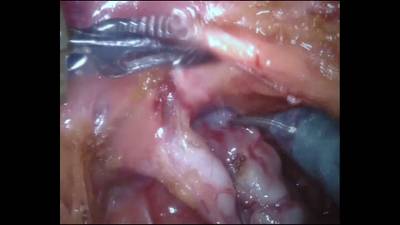
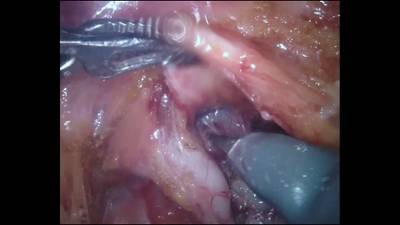
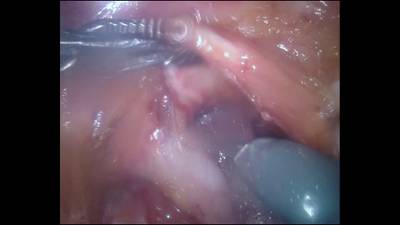
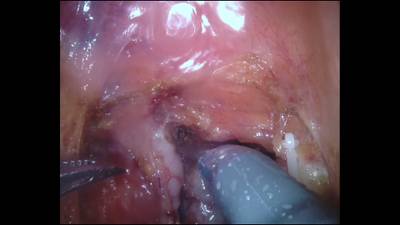
The ESAD dataset is a benchmark for action detection in the surgical domain, comprising four sessions of complete prostatectomy procedures performed by expert surgeons on real patients with prostate cancer. The dataset is unique as it involves recordings from the da Vinci Xi robotic system, integrated with a binocular endoscope, which provides detailed visual information during different stages of the operation. The videos used in the dataset are monocular.
The following guidelines were enforced for the annotation:
- Each bounding box should contain both the organ and tool acting for consideration, as each action class is highly dependent on the organ under operation.
- To balance the presence of tools and organs or tissue in a bounding box, bounding boxes are restricted to containing 30%-70% of either tools or organs.
- An action label is only assigned when a tool is close enough to the appropriate organ, as informed by the medical expert. Similarly, an action stops as soon as the tool starts to move away from the organ.
- Each video frame can have two actions, whose bounding boxes are allowed to overlap.
The ESAD dataset is divided into three sets: train, validation, and test. The training data contains 22,601 annotated frames with 28,055 action instances, while the validation data consists of 4,574 frames with 7,133 action instances. The test data, yet to be released, will contain 6,223 annotated frames with 11,565 action instances.
For the creation of the dataset, the authors collected complete prostatectomy procedure videos with the consent of patients and the hospital. Each video is approximately 2 hours and 20 minutes long, and annotation is performed at 1 FPS to maintain scene variation. The dataset includes 21 different action classes, each representing specific surgical actions performed during the procedure. The classes were carefully selected in consultation with multiple surgeons and medical professionals to strike a balance between simplicity and complexity. The dataset faces class imbalance, reflecting the nature of surgical procedures, with common actions having more samples than rarer actions.
Detailed guidelines were provided to annotators to standardize the annotation process, ensuring that each bounding box contains both the tool acting and the organ under operation, as these factors significantly influence action detection. The ESAD dataset is a valuable resource for advancing the development of an online surgeon action detection system and introducing partial/full autonomy in surgical robotics.
Summary #
SARAS Endoscopic Vision Challenge for Surgeon Action Detection 2020 is a dataset for an object detection task. It is used in the medical and robotics industries.
The dataset consists of 53370 images with 46325 labeled objects belonging to 21 different classes including PullingTissue, CuttingTissue, SuckingBlood, and other: BladderAnastomosis, PullingSeminalVesicle, CuttingSeminalVesicle, BladderNeckDissection, CuttingProstate, PullingProstate, SuckingSmoke, UrethraDissection, PullingVasDeferens, PullingBladderNeck, CuttingMesocolon, ClippingTissue, ClippingBladderNeck, ClippingSeminalVesicle, CuttingThread, CuttingVasDeferens, ClippingVasDeferens, and BaggingProstate.
Images in the SARAS-ESAD 2020 dataset have bounding box annotations. There are 23919 (45% of the total) unlabeled images (i.e. without annotations). There are 3 splits in the dataset: train (40152 images), val (7130 images), and test (6088 images). The dataset was released in 2020 by the Smart Autonomous Robotic Assistant Surgeon (SARAS) EU Consortium.

Explore #
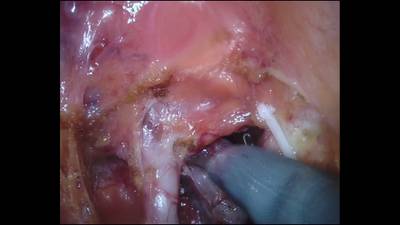
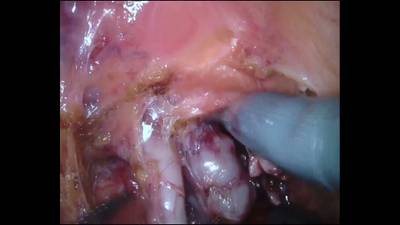
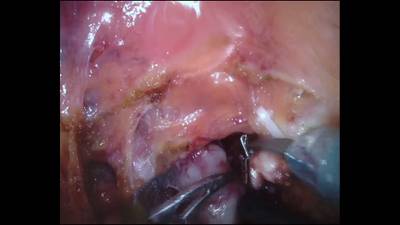
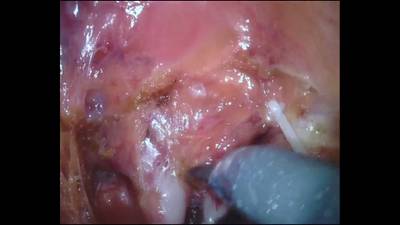
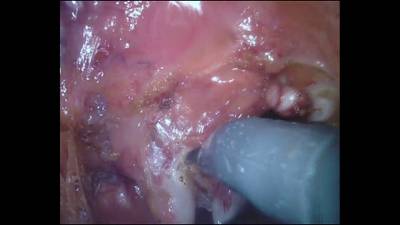
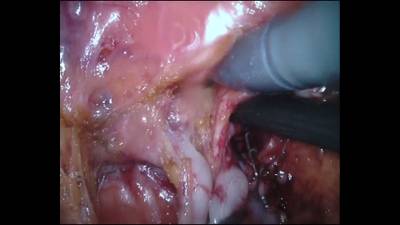
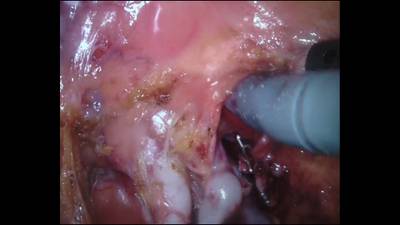
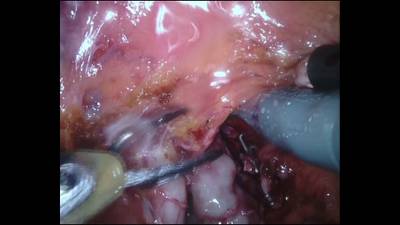
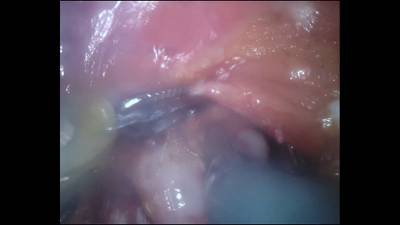
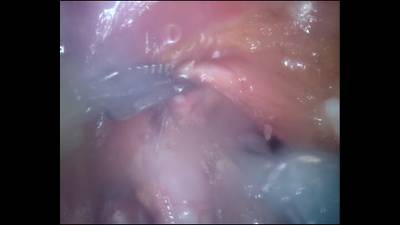
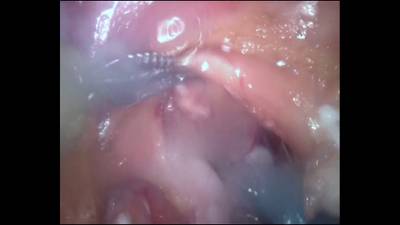
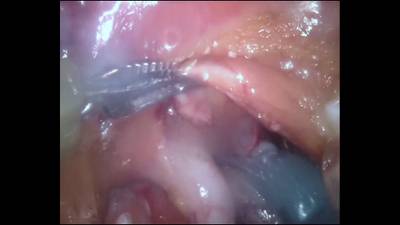
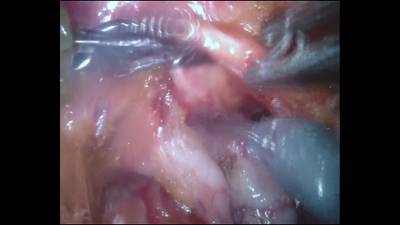
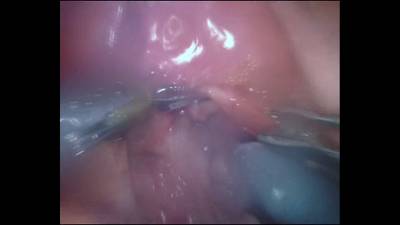
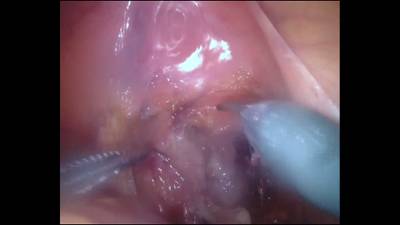
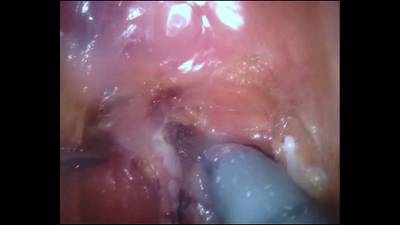
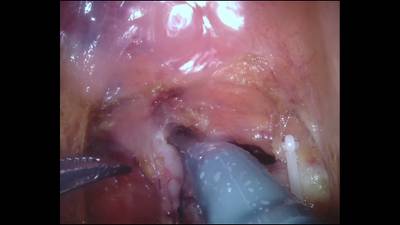
SARAS-ESAD 2020 dataset has 53370 images. Click on one of the examples below or open "Explore" tool anytime you need to view dataset images with annotations. This tool has extended visualization capabilities like zoom, translation, objects table, custom filters and more. Hover the mouse over the images to hide or show annotations.





























Class balance #
There are 21 annotation classes in the dataset. Find the general statistics and balances for every class in the table below. Click any row to preview images that have labels of the selected class. Sort by column to find the most rare or prevalent classes.
Class ㅤ | Images ㅤ | Objects ㅤ | Count on image average | Area on image average |
|---|---|---|---|---|
PullingTissue➔ rectangle | 8485 | 9078 | 1.07 | 8.62% |
CuttingTissue➔ rectangle | 7537 | 7547 | 1 | 7.63% |
SuckingBlood➔ rectangle | 6024 | 6024 | 1 | 7.07% |
BladderAnastomosis➔ rectangle | 5676 | 5711 | 1.01 | 35.71% |
PullingSeminalVesicle➔ rectangle | 3420 | 3490 | 1.02 | 14.65% |
CuttingSeminalVesicle➔ rectangle | 3012 | 3012 | 1 | 16.64% |
BladderNeckDissection➔ rectangle | 2392 | 2423 | 1.01 | 30.22% |
CuttingProstate➔ rectangle | 1948 | 1949 | 1 | 21.98% |
PullingProstate➔ rectangle | 1402 | 1421 | 1.01 | 13.99% |
SuckingSmoke➔ rectangle | 1385 | 1390 | 1 | 6.3% |
Co-occurrence matrix #
Co-occurrence matrix is an extremely valuable tool that shows you the images for every pair of classes: how many images have objects of both classes at the same time. If you click any cell, you will see those images. We added the tooltip with an explanation for every cell for your convenience, just hover the mouse over a cell to preview the description.
Images #
Explore every single image in the dataset with respect to the number of annotations of each class it has. Click a row to preview selected image. Sort by any column to find anomalies and edge cases. Use horizontal scroll if the table has many columns for a large number of classes in the dataset.
Object distribution #
Interactive heatmap chart for every class with object distribution shows how many images are in the dataset with a certain number of objects of a specific class. Users can click cell and see the list of all corresponding images.
Class sizes #
The table below gives various size properties of objects for every class. Click a row to see the image with annotations of the selected class. Sort columns to find classes with the smallest or largest objects or understand the size differences between classes.
Class | Object count | Avg area | Max area | Min area | Min height | Min height | Max height | Max height | Avg height | Avg height | Min width | Min width | Max width | Max width |
|---|---|---|---|---|---|---|---|---|---|---|---|---|---|---|
PullingTissue rectangle | 9078 | 8.08% | 40.53% | 0.53% | 68px | 6.3% | 841px | 77.87% | 373px | 34.56% | 84px | 4.38% | 1125px | 58.59% |
CuttingTissue rectangle | 7547 | 7.62% | 35.7% | 0.82% | 108px | 10% | 797px | 73.8% | 362px | 33.52% | 126px | 6.56% | 1197px | 62.34% |
SuckingBlood rectangle | 6024 | 7.07% | 18.78% | 1.21% | 96px | 8.89% | 629px | 58.24% | 353px | 32.71% | 169px | 8.8% | 757px | 39.43% |
BladderAnastomosis rectangle | 5711 | 35.51% | 60.63% | 2.87% | 210px | 19.44% | 1067px | 98.8% | 758px | 70.21% | 239px | 12.45% | 1231px | 64.11% |
PullingSeminalVesicle rectangle | 3490 | 14.44% | 49.63% | 2.45% | 161px | 14.91% | 990px | 91.67% | 496px | 45.93% | 226px | 11.77% | 1221px | 63.59% |
CuttingSeminalVesicle rectangle | 3012 | 16.64% | 39.6% | 2.87% | 195px | 18.06% | 1006px | 93.15% | 537px | 49.74% | 242px | 12.6% | 1109px | 57.76% |
BladderNeckDissection rectangle | 2423 | 29.85% | 58.41% | 2.41% | 162px | 15% | 1048px | 97.04% | 687px | 63.63% | 257px | 13.39% | 1158px | 60.31% |
CuttingProstate rectangle | 1949 | 21.97% | 41.15% | 2.52% | 192px | 17.78% | 1047px | 96.94% | 629px | 58.2% | 259px | 13.49% | 1058px | 55.1% |
PullingProstate rectangle | 1421 | 13.8% | 26.44% | 2.91% | 184px | 17.04% | 858px | 79.44% | 512px | 47.38% | 248px | 12.92% | 816px | 42.5% |
SuckingSmoke rectangle | 1390 | 6.28% | 18.69% | 0.99% | 114px | 10.56% | 618px | 57.22% | 320px | 29.64% | 174px | 9.06% | 830px | 43.23% |
UrethraDissection rectangle | 846 | 13.42% | 55.42% | 2.15% | 165px | 15.28% | 1067px | 98.8% | 468px | 43.35% | 245px | 12.76% | 1155px | 60.16% |
PullingVasDeferens rectangle | 815 | 12.91% | 26.11% | 3.32% | 213px | 19.72% | 950px | 87.96% | 455px | 42.14% | 241px | 12.55% | 963px | 50.16% |
PullingBladderNeck rectangle | 803 | 5.81% | 18.74% | 2.2% | 134px | 12.41% | 581px | 53.8% | 311px | 28.83% | 211px | 10.99% | 922px | 48.02% |
CuttingMesocolon rectangle | 682 | 12.46% | 27.7% | 2.69% | 204px | 18.89% | 955px | 88.43% | 428px | 39.59% | 223px | 11.61% | 962px | 50.1% |
ClippingTissue rectangle | 274 | 8.77% | 23.66% | 1.61% | 158px | 14.63% | 652px | 60.37% | 384px | 35.56% | 195px | 10.16% | 914px | 47.6% |
ClippingBladderNeck rectangle | 193 | 21.48% | 41.55% | 2.61% | 195px | 18.06% | 959px | 88.8% | 555px | 51.42% | 238px | 12.4% | 1158px | 60.31% |
ClippingSeminalVesicle rectangle | 186 | 15.81% | 28.07% | 2.78% | 230px | 21.3% | 626px | 57.96% | 487px | 45.09% | 241px | 12.55% | 970px | 50.52% |
CuttingThread rectangle | 170 | 17.68% | 35.95% | 1.66% | 160px | 14.81% | 789px | 73.06% | 501px | 46.43% | 215px | 11.2% | 1140px | 59.38% |
CuttingVasDeferens rectangle | 129 | 17.37% | 48.73% | 3.59% | 252px | 23.33% | 812px | 75.19% | 516px | 47.77% | 295px | 15.36% | 1246px | 64.9% |
ClippingVasDeferens rectangle | 106 | 17.27% | 45.02% | 4.69% | 311px | 28.8% | 723px | 66.94% | 556px | 51.5% | 313px | 16.3% | 1294px | 67.4% |
BaggingProstate rectangle | 76 | 38.25% | 64.66% | 13.81% | 323px | 29.91% | 1067px | 98.8% | 796px | 73.68% | 573px | 29.84% | 1308px | 68.12% |
Spatial Heatmap #
The heatmaps below give the spatial distributions of all objects for every class. These visualizations provide insights into the most probable and rare object locations on the image. It helps analyze objects' placements in a dataset.

Objects #
Table contains all 46325 objects. Click a row to preview an image with annotations, and use search or pagination to navigate. Sort columns to find outliers in the dataset.
Object ID ㅤ | Class ㅤ | Image name click row to open | Image size height x width | Height ㅤ | Height ㅤ | Width ㅤ | Width ㅤ | Area ㅤ |
|---|---|---|---|---|---|---|---|---|
1➔ | PullingTissue rectangle | RARP1_frame_2623.jpg | 1080 x 1920 | 472px | 43.7% | 454px | 23.65% | 10.33% |
2➔ | PullingSeminalVesicle rectangle | RARP1_frame_929.jpg | 1080 x 1920 | 504px | 46.67% | 516px | 26.88% | 12.54% |
3➔ | ClippingSeminalVesicle rectangle | RARP1_frame_929.jpg | 1080 x 1920 | 620px | 57.41% | 364px | 18.96% | 10.88% |
4➔ | CuttingTissue rectangle | RARP1_frame_4380.jpg | 1080 x 1920 | 254px | 23.52% | 351px | 18.28% | 4.3% |
5➔ | CuttingTissue rectangle | RARP1_frame_3281.jpg | 1080 x 1920 | 326px | 30.19% | 414px | 21.56% | 6.51% |
6➔ | PullingSeminalVesicle rectangle | RARP1_frame_5798.jpg | 1080 x 1920 | 529px | 48.98% | 437px | 22.76% | 11.15% |
7➔ | UrethraDissection rectangle | RARP1_frame_6196.jpg | 1080 x 1920 | 287px | 26.57% | 398px | 20.73% | 5.51% |
8➔ | PullingBladderNeck rectangle | RARP1_frame_6196.jpg | 1080 x 1920 | 226px | 20.93% | 359px | 18.7% | 3.91% |
9➔ | CuttingTissue rectangle | RARP1_frame_4827.jpg | 1080 x 1920 | 231px | 21.39% | 265px | 13.8% | 2.95% |
10➔ | PullingTissue rectangle | RARP1_frame_4827.jpg | 1080 x 1920 | 342px | 31.67% | 267px | 13.91% | 4.4% |
License #
SARAS Endoscopic Vision Challenge for Surgeon Action Detection 2020 is under CC BY-NC-SA 3.0 US license.
Citation #
If you make use of the SARAS-ESAD 2020 data, please cite the following reference:
@misc{bawa2020esad,
      title={ESAD: Endoscopic Surgeon Action Detection Dataset},
      author={Vivek Singh Bawa and Gurkirt Singh and Francis KapingA and Inna Skarga-Bandurova and Alice Leporini and Carmela Landolfo and Armando Stabile and Francesco Setti and Riccardo Muradore and Elettra Oleari and Fabio Cuzzolin},
      year={2020},
      eprint={2006.07164},
      archivePrefix={arXiv},
      primaryClass={cs.CV}
}
If you are happy with Dataset Ninja and use provided visualizations and tools in your work, please cite us:
@misc{ visualization-tools-for-saras-esad-dataset,
  title = { Visualization Tools for SARAS-ESAD 2020 Dataset },
  type = { Computer Vision Tools },
  author = { Dataset Ninja },
  howpublished = { \url{ https://datasetninja.com/saras-esad-2020 } },
  url = { https://datasetninja.com/saras-esad-2020 },
  journal = { Dataset Ninja },
  publisher = { Dataset Ninja },
  year = { 2026 },
  month = { feb },
  note = { visited on 2026-02-23 },
}
Download #
Dataset SARAS-ESAD 2020 can be downloaded in Supervisely format:
As an alternative, it can be downloaded with dataset-tools package:
pip install --upgrade dataset-tools
… using following python code:
import dataset_tools as dtools

dtools.download(dataset='SARAS-ESAD 2020', dst_dir='~/dataset-ninja/')
Make sure not to overlook the python code example available on the Supervisely Developer Portal. It will give you a clear idea of how to effortlessly work with the downloaded dataset.
The data in original format can be downloaded here:
Disclaimer #
Our gal from the legal dep told us we need to post this:
Dataset Ninja provides visualizations and statistics for some datasets that can be found online and can be downloaded by general audience. Dataset Ninja is not a dataset hosting platform and can only be used for informational purposes. The platform does not claim any rights for the original content, including images, videos, annotations and descriptions. Joint publishing is prohibited.
You take full responsibility when you use datasets presented at Dataset Ninja, as well as other information, including visualizations and statistics we provide. You are in charge of compliance with any dataset license and all other permissions. You are required to navigate datasets homepage and make sure that you can use it. In case of any questions, get in touch with us at hello@datasetninja.com.


