Introduction #
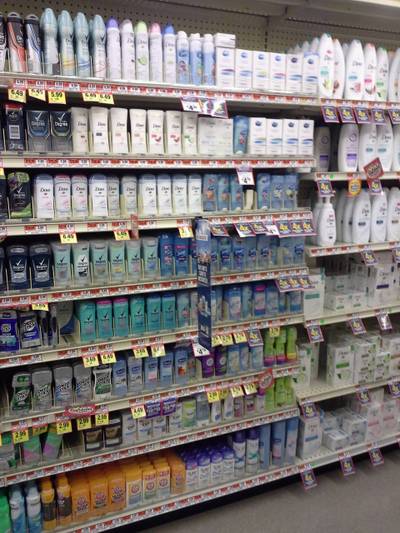
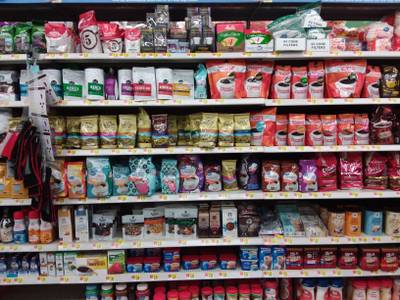
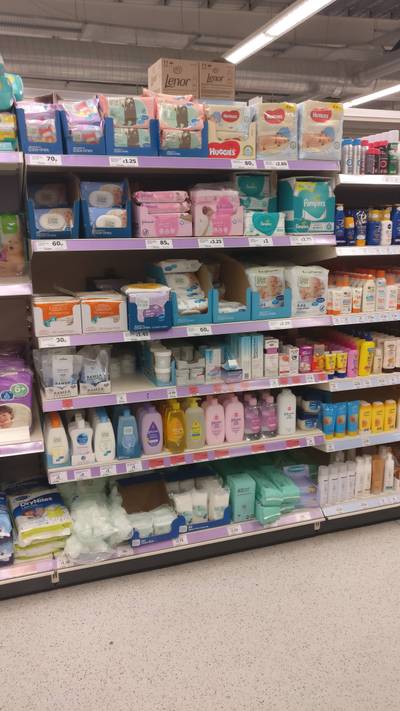
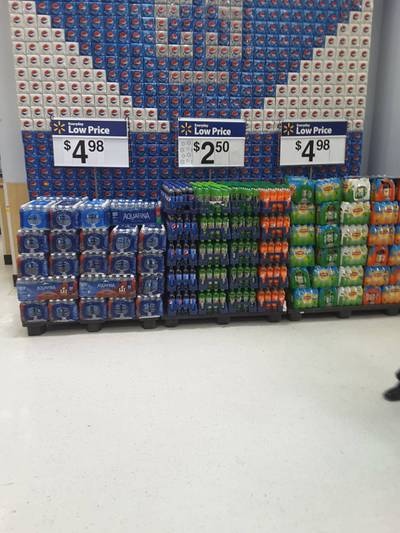
Object detection in densely packed, man-made scenes poses a significant challenge, especially when objects are numerous, identical, and closely positioned. The authors of the SKU110K dataset address this frontier with a novel deep-learning method designed explicitly for such challenging settings. They introduce an extensive annotated retail dataset consisting of more than 11K images and around 1M bounding boxes.
The authors mention densely packed scenes, such as retail shelf displays, traffic, and urban landscapes, where numerous objects, often similar or identical, are in close proximity. Despite the prevalence of such environments, they are underrepresented in existing object detection benchmarks, leading to challenges for state-of-the-art detectors. Identifying boundaries between identical objects and minimizing overlaps present significant difficulties, as demonstrated by the limitations of existing detectors.
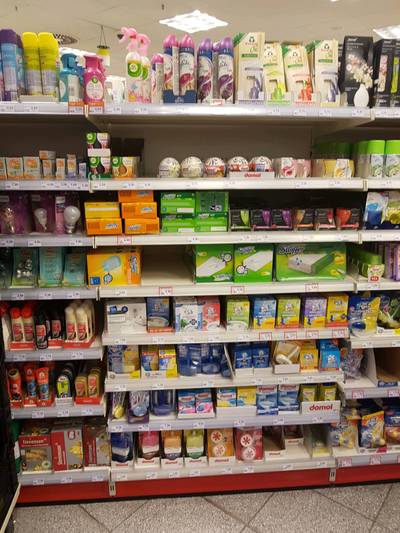
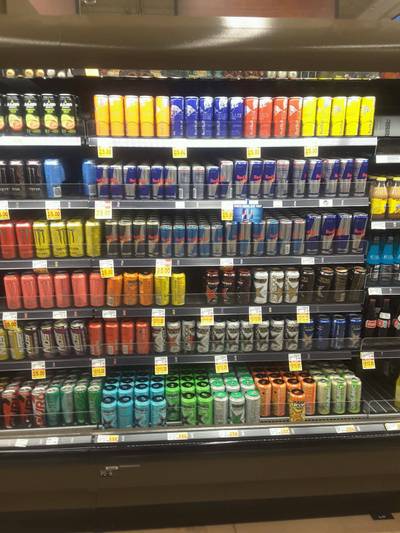
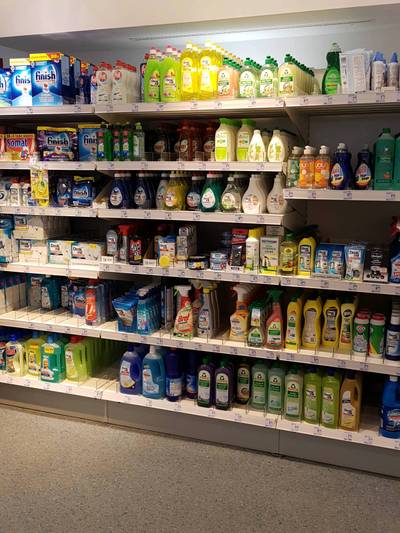
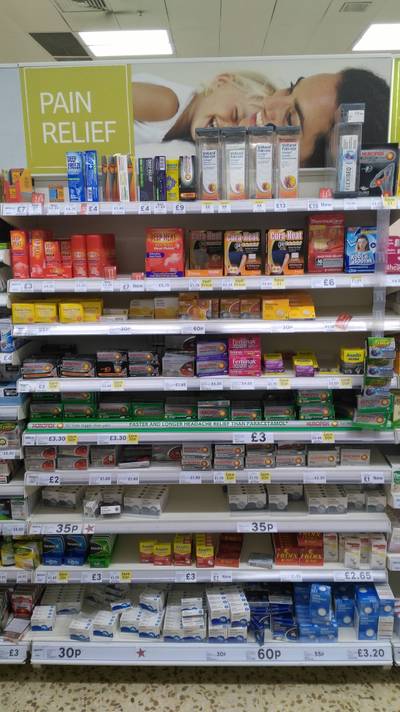
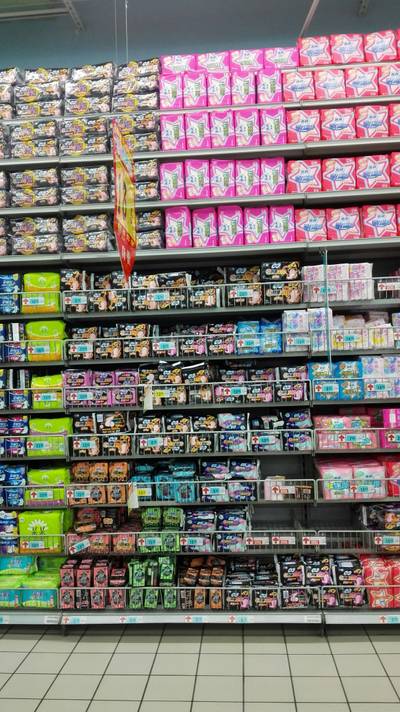
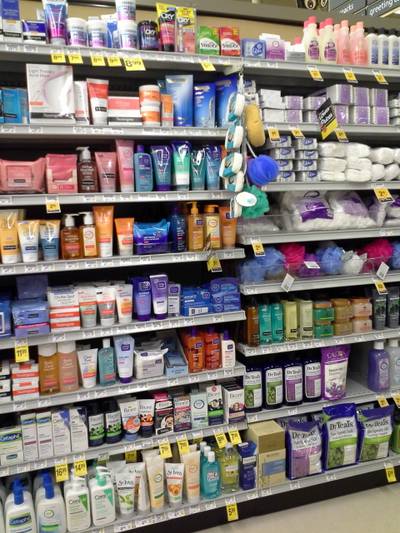
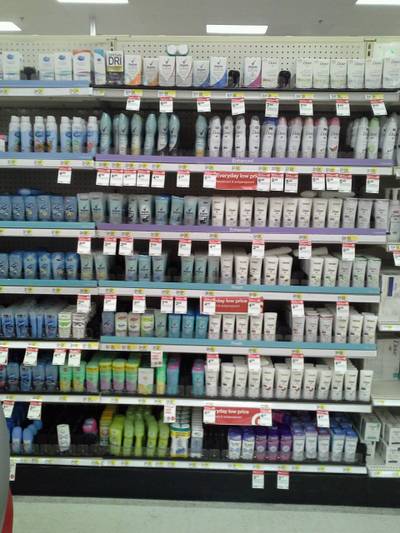
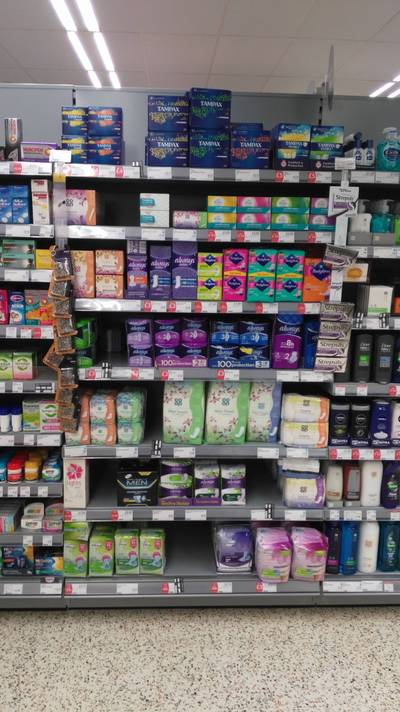
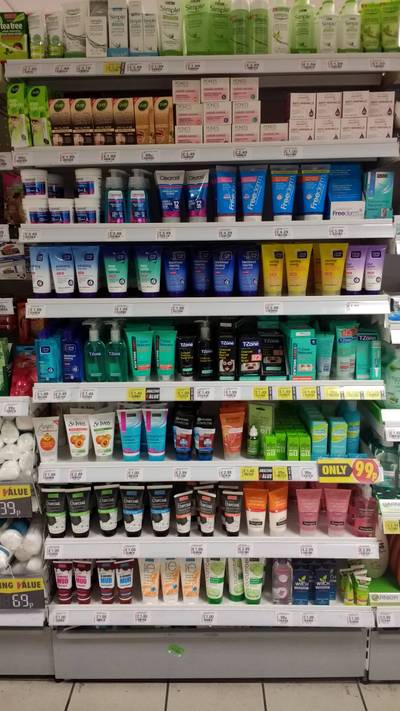
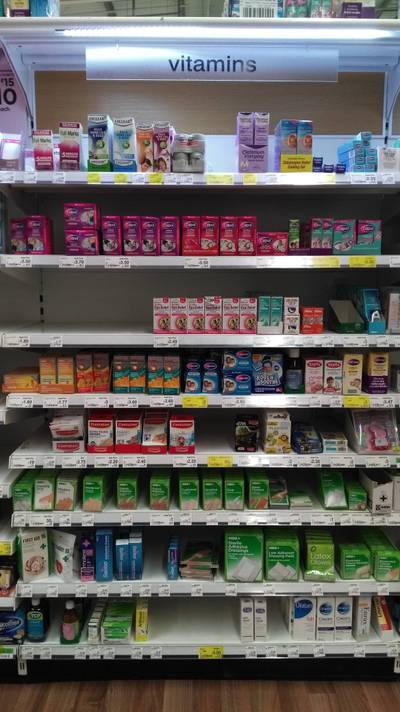
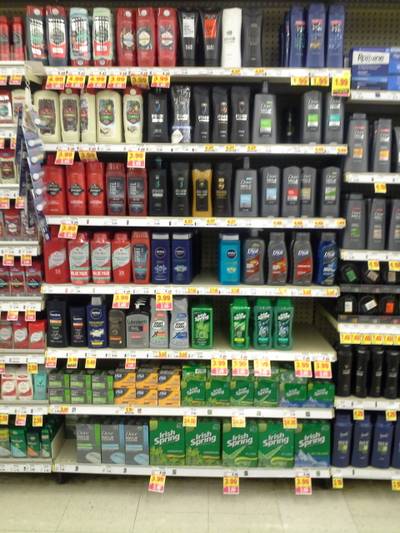
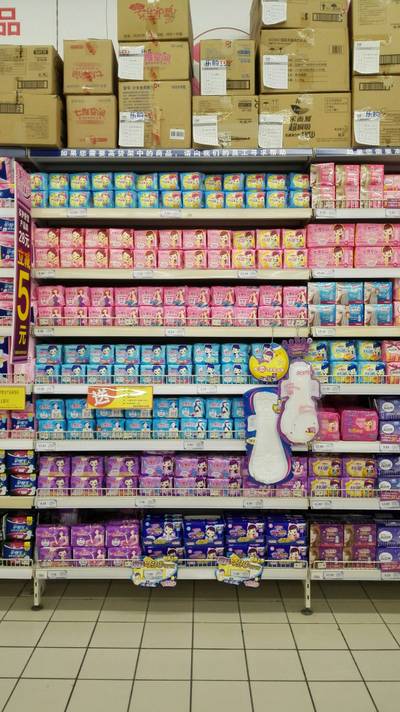
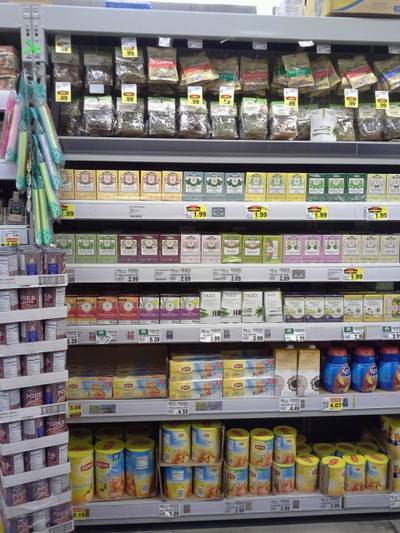
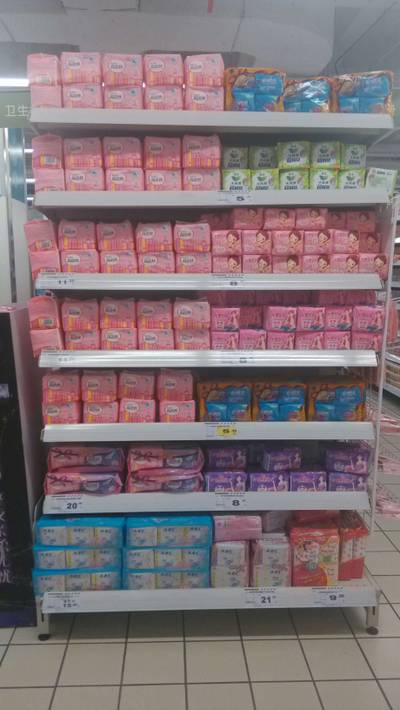
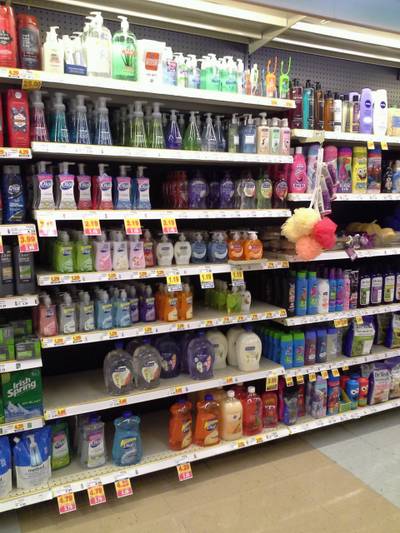
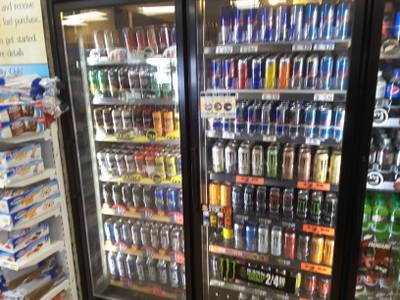
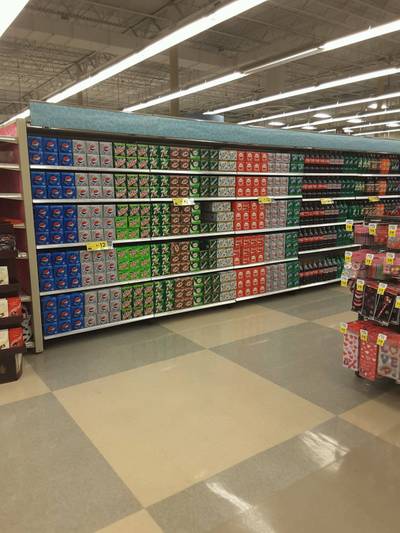
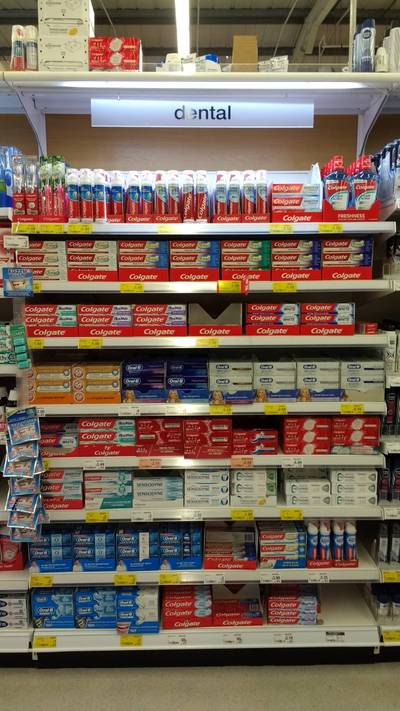
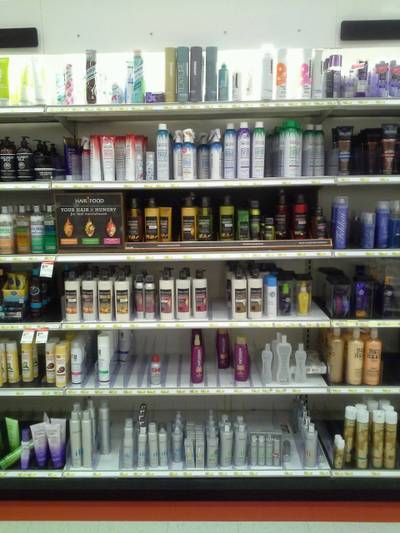
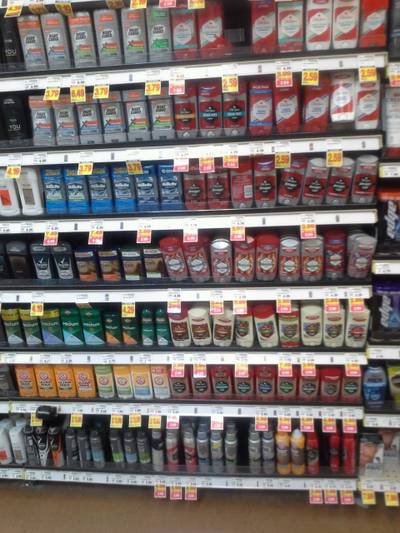
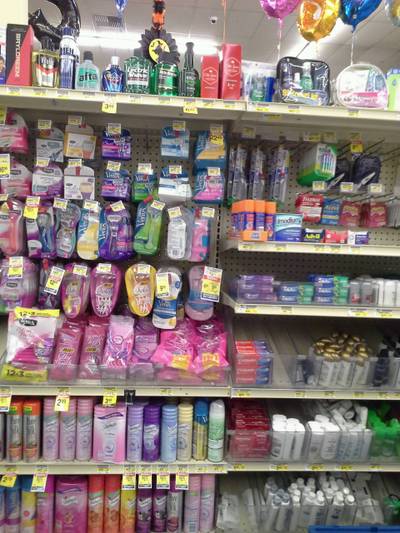
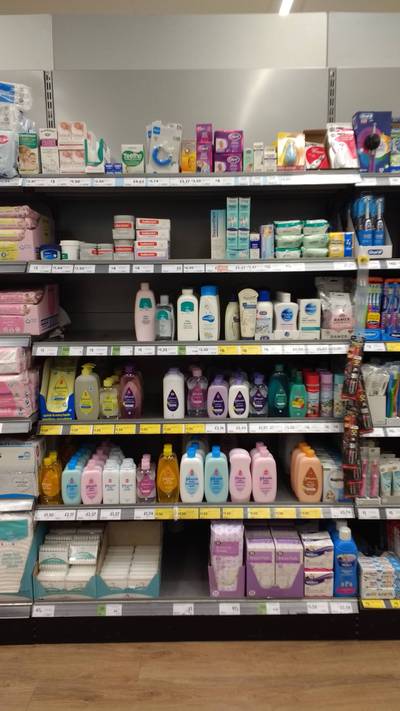
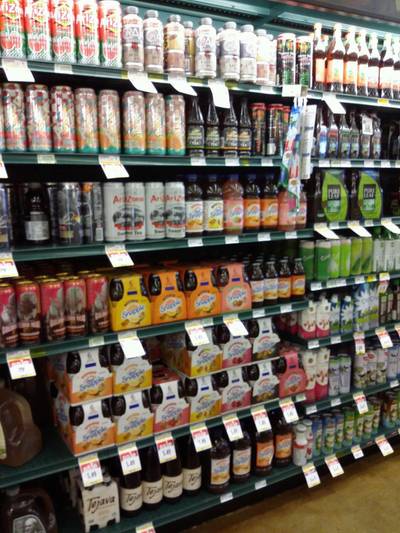
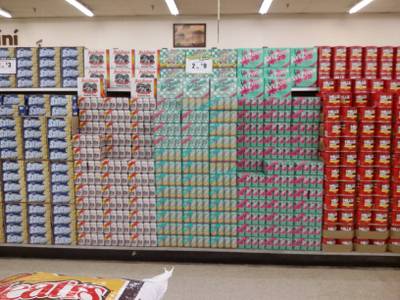
To address the scarcity of datasets catering to densely packed scenes, the authors assembled SKU-110K, a labeled dataset centered around images of supermarket shelves. The choice of retail environments is motivated by the optimization of shelves for presenting many items in tightly packed arrangements. The dataset comprises extreme examples of dense environments, reflecting the authors’ specific interest in such scenes.
Data Acquisition
Associates from around the world captured images using personal cellphone cameras, resulting in images with varying quality and view settings. Annotations were performed by skilled annotators to ensure accuracy, and each image, along with its detection labels, underwent visual inspection to filter out localization errors.
Dataset Characteristics
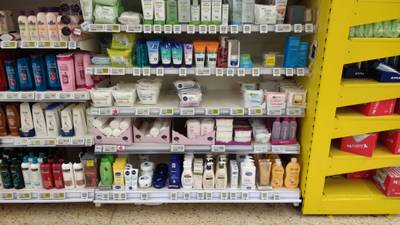
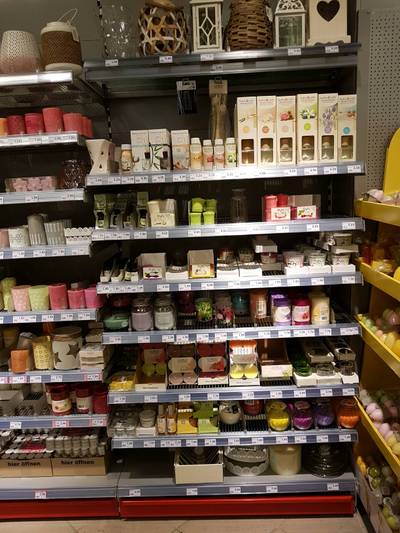
The dataset showcases the challenges of densely packed environments with variations in spatial transformations, image quality, and occlusion. Images from SKU-110K were collected globally from thousands of supermarket stores, introducing diverse scales, viewing angles, lighting conditions, and other sources of variability.
SKU-110K images were partitioned into train, test, and val splits, with 70%, 5%, and 25% of the images allocated, respectively. Random selection ensures that the same shelf display from the same shop does not appear in more than one subset.
Summary #
SKU110K: Densely Packed Scenes for 110K Categories of Retail Items is a dataset for an object detection task. It is used in the retail industry.
The dataset consists of 11689 images with 1723135 labeled objects belonging to 1 single class (retail item).
Images in the SKU110K dataset have bounding box annotations. All images are labeled (i.e. with annotations). There are 3 splits in the dataset: train (8185 images), test (2920 images), and val (584 images). The dataset was released in 2019 by the Bar-Ilan University, Israel, Tel Aviv University, Israel, Trax Retail, Singapore, and The Open University of Israel.

Explore #
SKU110K dataset has 11689 images. Click on one of the examples below or open "Explore" tool anytime you need to view dataset images with annotations. This tool has extended visualization capabilities like zoom, translation, objects table, custom filters and more. Hover the mouse over the images to hide or show annotations.






























Class balance #
There are 1 annotation classes in the dataset. Find the general statistics and balances for every class in the table below. Click any row to preview images that have labels of the selected class. Sort by column to find the most rare or prevalent classes.
Class ㅤ | Images ㅤ | Objects ㅤ | Count on image average | Area on image average |
|---|---|---|---|---|
retail item➔ rectangle | 11689 | 1723135 | 147.42 | 42.58% |
Images #
Explore every single image in the dataset with respect to the number of annotations of each class it has. Click a row to preview selected image. Sort by any column to find anomalies and edge cases. Use horizontal scroll if the table has many columns for a large number of classes in the dataset.
Class sizes #
The table below gives various size properties of objects for every class. Click a row to see the image with annotations of the selected class. Sort columns to find classes with the smallest or largest objects or understand the size differences between classes.
Class | Object count | Avg area | Max area | Min area | Min height | Min height | Max height | Max height | Avg height | Avg height | Min width | Min width | Max width | Max width |
|---|---|---|---|---|---|---|---|---|---|---|---|---|---|---|
retail item rectangle | 1723135 | 0.29% | 20.85% | 0% | 21px | 0.43% | 2846px | 69.98% | 191px | 6.14% | 17px | 0.51% | 2227px | 88.39% |
Spatial Heatmap #
The heatmaps below give the spatial distributions of all objects for every class. These visualizations provide insights into the most probable and rare object locations on the image. It helps analyze objects' placements in a dataset.

Objects #
Table contains all 97563 objects. Click a row to preview an image with annotations, and use search or pagination to navigate. Sort columns to find outliers in the dataset.
Object ID ㅤ | Class ㅤ | Image name click row to open | Image size height x width | Height ㅤ | Height ㅤ | Width ㅤ | Width ㅤ | Area ㅤ |
|---|---|---|---|---|---|---|---|---|
1➔ | retail item rectangle | val_234.jpg | 2560 x 1920 | 224px | 8.75% | 87px | 4.53% | 0.4% |
2➔ | retail item rectangle | val_234.jpg | 2560 x 1920 | 196px | 7.66% | 86px | 4.48% | 0.34% |
3➔ | retail item rectangle | val_234.jpg | 2560 x 1920 | 216px | 8.44% | 85px | 4.43% | 0.37% |
4➔ | retail item rectangle | val_234.jpg | 2560 x 1920 | 204px | 7.97% | 84px | 4.38% | 0.35% |
5➔ | retail item rectangle | val_234.jpg | 2560 x 1920 | 205px | 8.01% | 87px | 4.53% | 0.36% |
6➔ | retail item rectangle | val_234.jpg | 2560 x 1920 | 202px | 7.89% | 75px | 3.91% | 0.31% |
7➔ | retail item rectangle | val_234.jpg | 2560 x 1920 | 203px | 7.93% | 99px | 5.16% | 0.41% |
8➔ | retail item rectangle | val_234.jpg | 2560 x 1920 | 195px | 7.62% | 85px | 4.43% | 0.34% |
9➔ | retail item rectangle | val_234.jpg | 2560 x 1920 | 197px | 7.7% | 83px | 4.32% | 0.33% |
10➔ | retail item rectangle | val_234.jpg | 2560 x 1920 | 201px | 7.85% | 73px | 3.8% | 0.3% |
License #
The SKU110K: Densely Packed Scenes for 110K Categories of Retail Items is publicly available.
Citation #
If you make use of the SKU110K data, please cite the following reference:
@inproceedings{goldman2019dense,
  author    = {Eran Goldman and Roei Herzig and Aviv Eisenschtat and Jacob Goldberger and Tal Hassner},
  title     = {Precise Detection in Densely Packed Scenes},
  booktitle = {Proc. Conf. Comput. Vision Pattern Recognition (CVPR)},
  year      = {2019}
}
If you are happy with Dataset Ninja and use provided visualizations and tools in your work, please cite us:
@misc{ visualization-tools-for-sku110k-dataset,
  title = { Visualization Tools for SKU110K Dataset },
  type = { Computer Vision Tools },
  author = { Dataset Ninja },
  howpublished = { \url{ https://datasetninja.com/sku110k } },
  url = { https://datasetninja.com/sku110k },
  journal = { Dataset Ninja },
  publisher = { Dataset Ninja },
  year = { 2026 },
  month = { feb },
  note = { visited on 2026-02-22 },
}
Download #
Dataset SKU110K can be downloaded in Supervisely format:
As an alternative, it can be downloaded with dataset-tools package:
pip install --upgrade dataset-tools
… using following python code:
import dataset_tools as dtools

dtools.download(dataset='SKU110K', dst_dir='~/dataset-ninja/')
Make sure not to overlook the python code example available on the Supervisely Developer Portal. It will give you a clear idea of how to effortlessly work with the downloaded dataset.
The data in original format can be downloaded here.
Disclaimer #
Our gal from the legal dep told us we need to post this:
Dataset Ninja provides visualizations and statistics for some datasets that can be found online and can be downloaded by general audience. Dataset Ninja is not a dataset hosting platform and can only be used for informational purposes. The platform does not claim any rights for the original content, including images, videos, annotations and descriptions. Joint publishing is prohibited.
You take full responsibility when you use datasets presented at Dataset Ninja, as well as other information, including visualizations and statistics we provide. You are in charge of compliance with any dataset license and all other permissions. You are required to navigate datasets homepage and make sure that you can use it. In case of any questions, get in touch with us at hello@datasetninja.com.


