Introduction #
The Stanford Cars Dataset is a comprehensive collection comprising 16,185 images covering 196 different classes of cars. This dataset is intelligently divided into 8,144 training images and 8,041 testing images, maintaining an approximate 50-50 split within each class. Classes primarily represent the Make, Model, and Year, such as the 2012_tesla_model_s or the 2012_bmw_m3_coupe. These detailed representations make it a valuable resource for multi-view object class detection and scene comprehension. As part of the growing area of fine-grained recognition in computer vision, it serves practical applications by discerning subtle appearance differences among cars. This dataset offers a rich source for training and testing models that are adept at distinguishing various car models from one another.
Motivation
The authors’ motivation in creating this dataset stemmed from the recognized potential of three-dimensional representations in computer vision, which have historically been regarded as the ultimate goal due to their promise of providing more accurate and concise depictions of the visual world compared to traditional view-based representations. While recent advancements have showcased the advantages of 3D representations in multi-view object class detection and scene understanding, their application in fine-grained recognition, an actively evolving domain within computer vision, has been notably scarce. Most leading approaches in fine-grained recognition still heavily rely on 2D image representations, which inherently limit their ability to capture intricate details, especially across various viewpoints. Understanding that the distinct characteristics defining fine-grained categories are more naturally represented in 3D object space, the authors aimed to rectify this gap. Their approach involved estimating the 3D geometry of objects to represent features in relation to this geometry, emphasizing both appearance and location of these features. Leveraging state-of-the-art 2D object representations and elevating them to 3D, the authors demonstrated the superiority of their 3D object representations in fine-grained categorization compared to existing 2D methods. Additionally, their contribution included introducing a new dataset encompassing 207 fine-grained categories, notably comprising a small-scale, ultra-fine-grained subset of 10 BMW models and a larger, more diverse set of 197 car types. The authors’ work not only showcased the benefits of their 3D object representation in estimating 3D geometry but also explored the challenging task of 3D reconstruction for fine-grained categories, an area largely unexplored in existing literature.
About Stanford Cars Dataset
Authors have collected a challenging, large-scale dataset of car models, to be made available upon publication. It consists of BMW-10, a small, ultra-fine-grained set of 10 BMW sedans (512 images) hand-collected by the authors, plus car-197, a large set of 197 car models (16,185 images) covering sedans, SUVs, coupes, convertibles, pickups, hatchbacks, and station wagons. Since dataset collection proved non-trivial, authors give the most important challenges and insights.
Identifying visually distinct classes
Since cars are manmade objects whose class list changes on a yearly basis, and models of cars do not have a different appearance from year to year, no simple list of visually distinct cars exists which authors can use as a base. They thus first crawl a popular car website for a list of all types of cars made since 1990. Authors then apply an aggressive deduplication procedure, based on perceptual hashing, to a limited number of provided example images for these classes, determining a subset of visually distinct classes, from which they sample 197 (see supplementary material for a complete list).
Finding candidate images
Candidate images for each class were collected from Flickr, Google, and Bing. To reduce annotation cost and ensure diversity in the data, the candidate images for each class were deduplicated using the same perceptual hash algorithm, leaving a set of several thousand candidate images for each of the 197 target classes. These images were then put on Amazon Mechanical Turk (AMT) in order to determine whether they belong to their respective target classes.
Training annotators
The main challenge in crowdsourcing the collection of a fine-grained dataset is that workers are typically non-experts. To compensate, authors implemented a qualification task (a set of particularly hard examples of the actual annotation task) and provide a set of positive and negative example images for the car class a worker is annotating, drawing the negative examples from classes known a priori to be similar to the target class.
Modeling annotator reliability
Even after training, workers differ in quality by large margins. To tackle this problem, authors use the Get Another Label (GAL) system, which simultaneously estimates the probability a candidate image belongs to its target class and determines a quality level for each worker. Candidate images whose probability of belonging to the target class exceeds a specified threshold are then added to the set of images for that category. After obtaining images for each of the 197 target classes, authors collect a bounding box for each image via AMT, using a quality-controlled system provided by the authors of source. Finally, an additional stage of deduplication is performed on the images when cropped to their bounding boxes.
One image each of 196 of the 197 classes in car-197 and each of the 10 classes in BMW-10.
Summary #
Stanford Cars is a dataset for an object detection task. It is applicable or relevant across various domains.
The dataset consists of 16185 images with 16185 labeled objects belonging to 197 different classes including car, gmc_savana_van_2012, chrysler_300_srt-8_2010, and other: mercedes-benz_300-class_convertible_1993, mitsubishi_lancer_sedan_2012, chevrolet_corvette_zr1_2012, jaguar_xk_xkr_2012, audi_s6_sedan_2011, bentley_continental_gt_coupe_2007, dodge_durango_suv_2007, eagle_talon_hatchback_1998, ford_gt_coupe_2006, mercedes-benz_c-class_sedan_2012, nissan_240sx_coupe_1998, suzuki_kizashi_sedan_2012, volkswagen_golf_hatchback_1991, volvo_240_sedan_1993, am_general_hummer_suv_2000, acura_integra_type_r_2001, aston_martin_v8_vantage_convertible_2012, audi_s4_sedan_2007, bmw_m3_coupe_2012, bentley_continental_flying_spur_sedan_2007, cadillac_escalade_ext_crew_cab_2007, chevrolet_camaro_convertible_2012, chevrolet_avalanche_crew_cab_2012, chevrolet_monte_carlo_coupe_2007, chevrolet_malibu_sedan_2007, and 169 more.
Images in the Stanford Cars dataset have bounding box annotations. All images are labeled (i.e. with annotations). There are 2 splits in the dataset: train (8144 images) and test (8041 images). The dataset was released in 2013 by the Stanford University, USA and Max Planck Institute for Informatics, Germany.
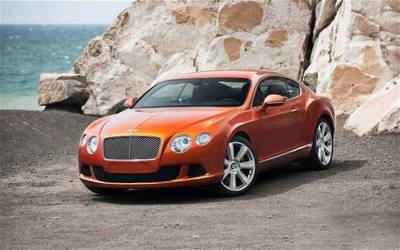
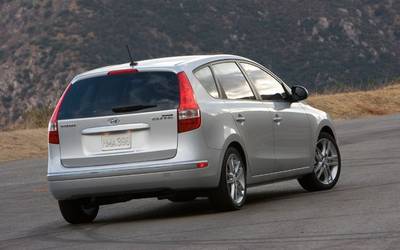
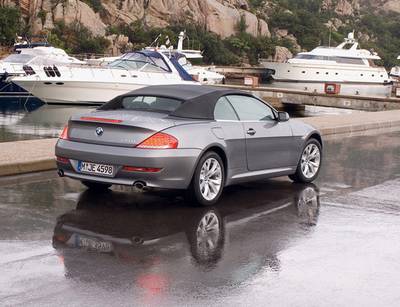
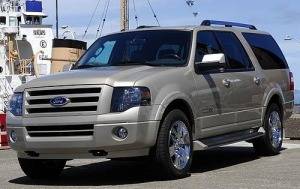
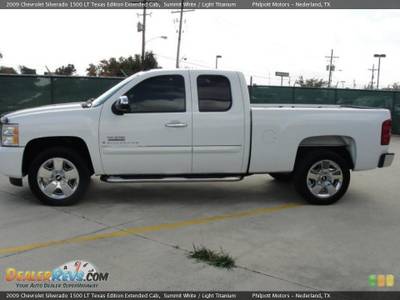
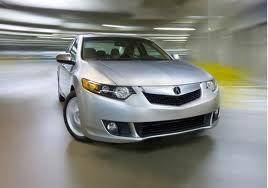
Here is a visualized example for randomly selected sample classes:
Explore #
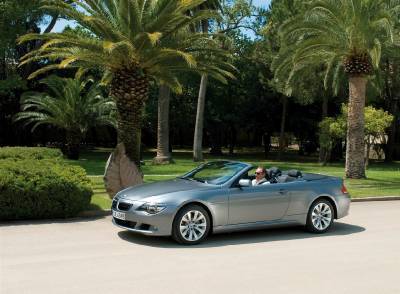
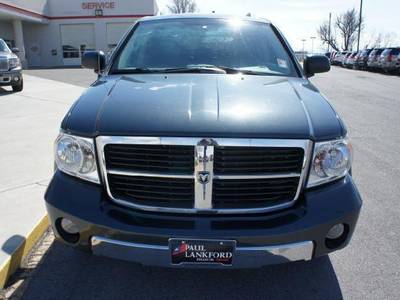
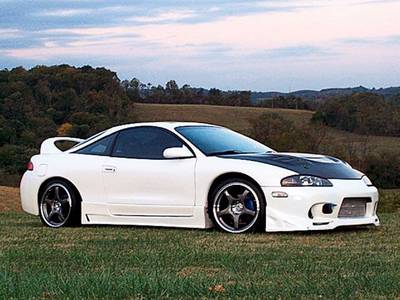
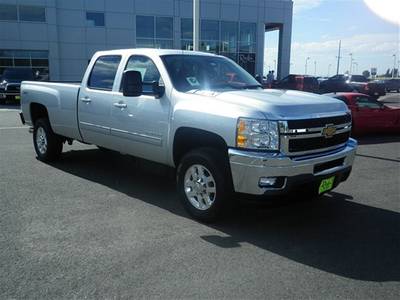
Stanford Cars dataset has 16185 images. Click on one of the examples below or open "Explore" tool anytime you need to view dataset images with annotations. This tool has extended visualization capabilities like zoom, translation, objects table, custom filters and more. Hover the mouse over the images to hide or show annotations.












Class balance #
There are 197 annotation classes in the dataset. Find the general statistics and balances for every class in the table below. Click any row to preview images that have labels of the selected class. Sort by column to find the most rare or prevalent classes.
Class ㅤ | Images ㅤ | Objects ㅤ | Count on image average | Area on image average |
|---|---|---|---|---|
car➔ rectangle | 8041 | 8041 | 1 | 55.24% |
gmc_savana_van_2012➔ rectangle | 68 | 68 | 1 | 58% |
chrysler_300_srt-8_2010➔ rectangle | 49 | 49 | 1 | 51.45% |
mitsubishi_lancer_sedan_2012➔ rectangle | 48 | 48 | 1 | 47.59% |
mercedes-benz_300-class_convertible_1993➔ rectangle | 48 | 48 | 1 | 56.1% |
jaguar_xk_xkr_2012➔ rectangle | 47 | 47 | 1 | 48.78% |
chevrolet_corvette_zr1_2012➔ rectangle | 47 | 47 | 1 | 50.13% |
volvo_240_sedan_1993➔ rectangle | 46 | 46 | 1 | 55.81% |
volkswagen_golf_hatchback_1991➔ rectangle | 46 | 46 | 1 | 57.77% |
suzuki_kizashi_sedan_2012➔ rectangle | 46 | 46 | 1 | 52.02% |
Images #
Explore every single image in the dataset with respect to the number of annotations of each class it has. Click a row to preview selected image. Sort by any column to find anomalies and edge cases. Use horizontal scroll if the table has many columns for a large number of classes in the dataset.
Object distribution #
Interactive heatmap chart for every class with object distribution shows how many images are in the dataset with a certain number of objects of a specific class. Users can click cell and see the list of all corresponding images.
Class sizes #
The table below gives various size properties of objects for every class. Click a row to see the image with annotations of the selected class. Sort columns to find classes with the smallest or largest objects or understand the size differences between classes.
Class | Object count | Avg area | Max area | Min area | Min height | Min height | Max height | Max height | Avg height | Avg height | Min width | Min width | Max width | Max width |
|---|---|---|---|---|---|---|---|---|---|---|---|---|---|---|
car rectangle | 8041 | 55.24% | 99.67% | 3.18% | 28px | 19.08% | 3389px | 99.87% | 310px | 65.55% | 71px | 15.06% | 6630px | 99.93% |
gmc_savana_van_2012 rectangle | 68 | 58% | 86.33% | 26.34% | 44px | 40.62% | 850px | 99.47% | 318px | 70.12% | 98px | 53.78% | 1852px | 99.29% |
chrysler_300_srt-8_2010 rectangle | 49 | 51.45% | 87.9% | 12.94% | 175px | 30.17% | 798px | 92.88% | 402px | 60.33% | 317px | 42.87% | 1537px | 99.38% |
mitsubishi_lancer_sedan_2012 rectangle | 48 | 47.59% | 87.59% | 12.66% | 248px | 29.22% | 1488px | 89.55% | 554px | 60.34% | 325px | 35.33% | 3398px | 99.92% |
mercedes-benz_300-class_convertible_1993 rectangle | 48 | 56.1% | 97.3% | 27.75% | 57px | 39.47% | 713px | 98.4% | 220px | 62.98% | 110px | 55% | 1479px | 99.84% |
jaguar_xk_xkr_2012 rectangle | 47 | 48.78% | 78.51% | 15.36% | 152px | 32.61% | 901px | 88.71% | 370px | 61.12% | 377px | 41.8% | 1804px | 99.41% |
chevrolet_corvette_zr1_2012 rectangle | 47 | 50.13% | 87.47% | 19.21% | 66px | 35.68% | 1573px | 92.9% | 274px | 60.18% | 143px | 38.78% | 3606px | 98.4% |
volvo_240_sedan_1993 rectangle | 46 | 55.81% | 94.72% | 20.77% | 133px | 35.91% | 828px | 99.55% | 363px | 64.71% | 332px | 51.88% | 1408px | 98.12% |
volkswagen_golf_hatchback_1991 rectangle | 46 | 57.77% | 88.7% | 31.8% | 187px | 44.83% | 1592px | 96.88% | 498px | 68.81% | 338px | 54.08% | 2565px | 99.81% |
suzuki_kizashi_sedan_2012 rectangle | 46 | 52.02% | 83.11% | 16.84% | 153px | 28.54% | 867px | 99.33% | 412px | 63.5% | 397px | 48.02% | 1741px | 98.59% |
Spatial Heatmap #
The heatmaps below give the spatial distributions of all objects for every class. These visualizations provide insights into the most probable and rare object locations on the image. It helps analyze objects' placements in a dataset.

Objects #
Table contains all 16185 objects. Click a row to preview an image with annotations, and use search or pagination to navigate. Sort columns to find outliers in the dataset.
Object ID ㅤ | Class ㅤ | Image name click row to open | Image size height x width | Height ㅤ | Height ㅤ | Width ㅤ | Width ㅤ | Area ㅤ |
|---|---|---|---|---|---|---|---|---|
1➔ | lamborghini_diablo_coupe_2001 rectangle | 07203.jpg | 319 x 483 | 184px | 57.68% | 464px | 96.07% | 55.41% |
2➔ | dodge_dakota_club_cab_2007 rectangle | 06913.jpg | 468 x 625 | 264px | 56.41% | 565px | 90.4% | 50.99% |
3➔ | chevrolet_trailblazer_ss_2009 rectangle | 05317.jpg | 345 x 520 | 243px | 70.43% | 453px | 87.12% | 61.36% |
4➔ | ford_edge_suv_2012 rectangle | 01448.jpg | 183 x 275 | 143px | 78.14% | 249px | 90.55% | 70.75% |
5➔ | daewoo_nubira_wagon_2002 rectangle | 05665.jpg | 225 x 300 | 151px | 67.11% | 257px | 85.67% | 57.49% |
6➔ | hyundai_azera_sedan_2012 rectangle | 01204.jpg | 800 x 1200 | 683px | 85.38% | 1025px | 85.42% | 72.92% |
7➔ | hummer_h3t_crew_cab_2010 rectangle | 01043.jpg | 853 x 1280 | 626px | 73.39% | 918px | 71.72% | 52.63% |
8➔ | chrysler_sebring_convertible_2010 rectangle | 00863.jpg | 480 x 640 | 334px | 69.58% | 598px | 93.44% | 65.02% |
9➔ | bentley_continental_gt_coupe_2007 rectangle | 01001.jpg | 370 x 625 | 290px | 78.38% | 576px | 92.16% | 72.23% |
10➔ | aston_martin_v8_vantage_coupe_2012 rectangle | 04509.jpg | 271 x 408 | 159px | 58.67% | 252px | 61.76% | 36.24% |
License #
License is unknown for the Stanford Cars dataset.
Citation #
If you make use of the Stanford Cars data, please cite the following reference:
@InProceedings{Krause_2013_ICCV_Workshops,
  author = {Krause, Jonathan and Stark, Michael and Deng, Jia and Fei-Fei, Li},
  title = {3D Object Representations for Fine-Grained Categorization},
  booktitle = {Proceedings of the IEEE International Conference on Computer Vision (ICCV) Workshops},
  month = {June},
  year = {2013}
}
If you are happy with Dataset Ninja and use provided visualizations and tools in your work, please cite us:
@misc{ visualization-tools-for-stanford-cars-dataset,
  title = { Visualization Tools for Stanford Cars Dataset },
  type = { Computer Vision Tools },
  author = { Dataset Ninja },
  howpublished = { \url{ https://datasetninja.com/stanford-cars } },
  url = { https://datasetninja.com/stanford-cars },
  journal = { Dataset Ninja },
  publisher = { Dataset Ninja },
  year = { 2026 },
  month = { feb },
  note = { visited on 2026-02-03 },
}
Download #
Please visit dataset homepage to download the data.
Disclaimer #
Our gal from the legal dep told us we need to post this:
Dataset Ninja provides visualizations and statistics for some datasets that can be found online and can be downloaded by general audience. Dataset Ninja is not a dataset hosting platform and can only be used for informational purposes. The platform does not claim any rights for the original content, including images, videos, annotations and descriptions. Joint publishing is prohibited.
You take full responsibility when you use datasets presented at Dataset Ninja, as well as other information, including visualizations and statistics we provide. You are in charge of compliance with any dataset license and all other permissions. You are required to navigate datasets homepage and make sure that you can use it. In case of any questions, get in touch with us at hello@datasetninja.com.


