Introduction #
TiCaM Synthectic Images: A Time-of-Flight In-Car Cabin Monitoring Dataset is a time-of-flight dataset of car in-cabin images providing means to test extensive car cabin monitoring systems based on deep learning methods. The authors provide a synthetic image dataset of car cabin images similar to the real dataset leveraging advanced simulation software’s capability to generate abundant data with little effort. This can be used to test domain adaptation between synthetic and real data for select classes. For both datasets the authors provide ground truth annotations for 2D and 3D object detection, as well as for instance segmentation.
Note, similar TiCaM Synthectic Images: A Time-of-Flight In-Car Cabin Monitoring Dataset dataset is also available on the DatasetNinja.com:
Dataset description
With the advent of autonomous and driver-less vehicles, it is imperative to monitor the entire in-car cabin scene in order to realize active and passive safety functions, as well as comfort functions and advanced human-vehicle interfaces. Such car cabin monitoring systems typically involve a camera fitted in the overhead module of a car and a suite of algorithms to monitor the environment within a vehicle. To aid these monitoring systems, several in-car datasets exist to train deep leaning methods for solving problems like driver distraction monitoring, occupant detection or activity recognition. The authors present TICaM, an in-car cabin dataset of 3.3k synthetic images with ground truth annotations for 2D and 3D object detection, and semantic and instance segmentation. Their intention is to provide a comprehensive in-car cabin depth image dataset that addresses the deficiencies of currently available such datasets in terms of the ambit of labeled classes, recorded scenarios and provided annotations; all at the same time.
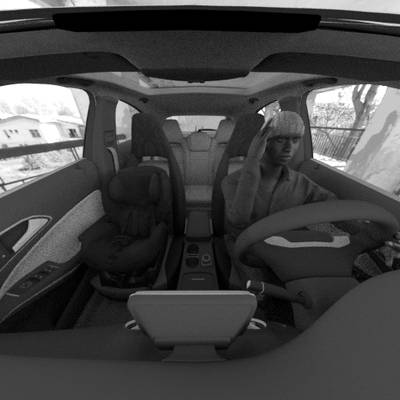
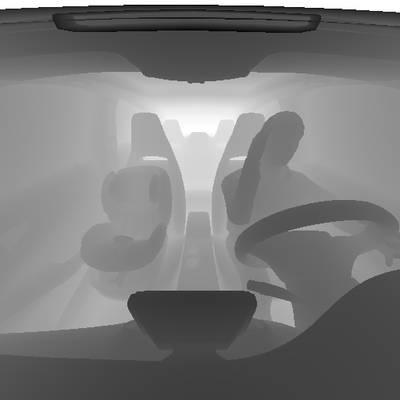
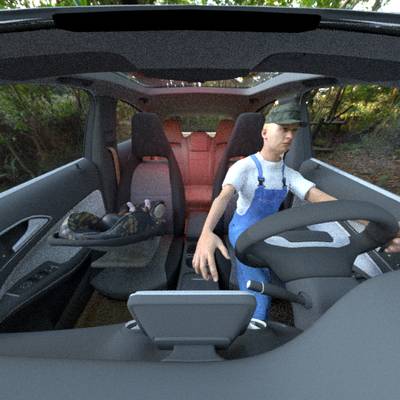
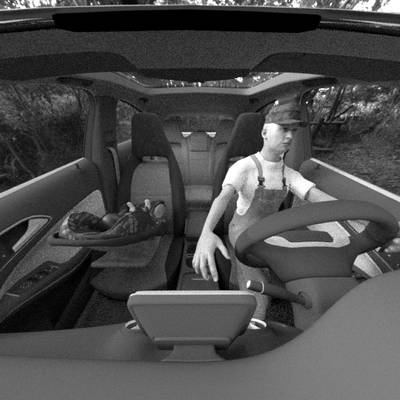
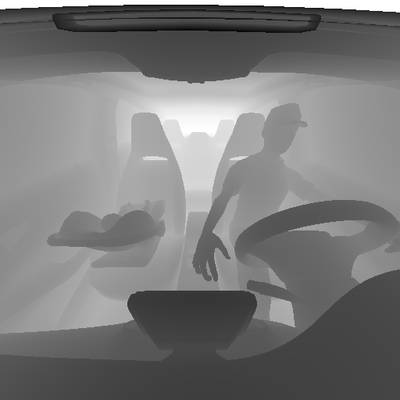
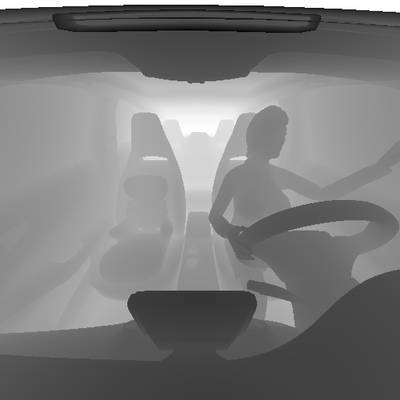
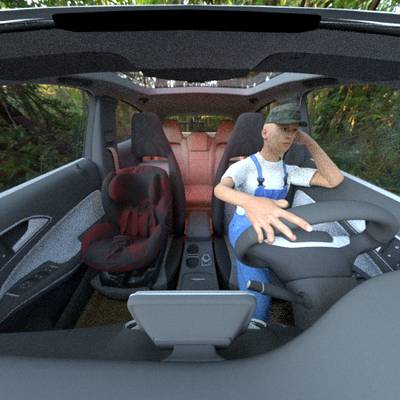
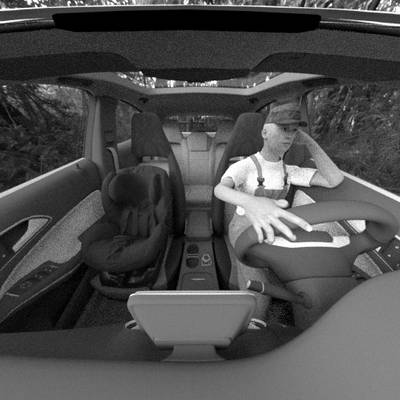
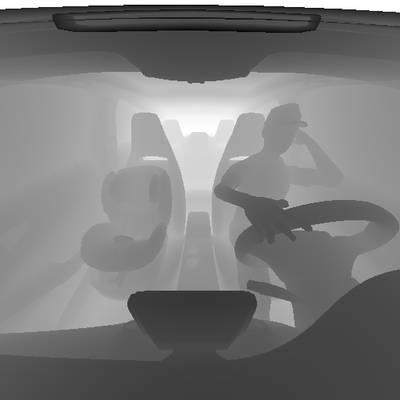
Synthetic images. RGB scene, depth image with 2D bounding box annotation, segmentation mask.
A noticeable constraint in existing car cabin datasets is the omission of certain frequently encountered driving scenarios. Notably absent are situations involving passengers, commonplace objects, and the presence of children and infants in forward and rearward facing child seats. The authors have conscientiously addressed this limitation by capturing a diverse array of everyday driving scenarios. This meticulous approach ensures that our dataset proves valuable for pivotal automotive safety applications, such as optimizing airbag adjustments. Using the same airbag configuration for both children and adults can pose a fatal risk to the child. Therefore, it is imperative to identify the occupant class (person, child, infant, object, or empty) for each car seat and determine the child seat configuration (forward-facing FF or rearward-facing RF). The dataset also includes annotations for both driver and passenger activities.
It is easier to generate realistic synthetic depth data for training machine learning systems than it is to generate RGB data. Compared to real datasets, creation and annotation of synthetic datasets is less time and effort expensive. Recognizing this fact has led authors to also create a synthetic front incar cabin dataset of over 3.3K depth, RGB and infrared images with same annotations for detection and segmentation tasks. The authors believe this addition makes their dataset uniquely useful for training and testing car cabin monitoring systems leveraging domain adaptation methods.
Synthetic Data Generation
The authors render synthetic car cabin images using 3D computer graphic software Blender 2.81. The 3D models of Mercedes A Class is from Hum3D, the everyday objects were downloaded from Sketchfab and the human models were generated via MakeHuman. In addition, High Dynamic Range Images (HDRI) was used to get different environmental backgrounds and illumination, and finally, in order to define the reflection properties and colors for the 3D objects, textures from Textures were obtained for each object.
In pursuit of simulating driving scenarios, the authors consistently designated the occupant of the driver’s seat as an adult in a driving pose. For the passenger seat, the occupant was randomly chosen from the remaining classes, including child seats (both empty and child-occupied), everyday objects, and adult passengers. While some objects, such as handbags, backpacks, and bottles, were selected to mirror those found in real driving scenarios, they were grouped under the overarching class everyday object. Similarly, children and infants were collectively categorized under the class person.
The authors recreated the actions participants were instructed to perform during the recording of the actual dataset. Given that driver poses are naturally constrained by the car elements they interact with, and to prevent any overlap, the authors established fixed poses for hand positions that align with possible real driving scenarios. Meanwhile, they allowed for movement in other body parts up to a specified threshold.
Different scenarios in the synthetic dataset.
Data Format
-
Depth Z-image. The depth image is undistorted with a pixel resolution of 512 × 512 pixels and captures a 105◦ × 105◦ FOV. The depth values are normalized to [1mm] resolution and clipped to a range of [0, 2550mm]. Invalid depth values are coded as ‘0’. Images are stored in 16bit PNG-format.
-
IR Amplitude Image. Undistorted IR images from the depth sensor are provided in the same format as the depth image above.
-
RGB Image. Undistorted color images are saved in PNG-format in 24bit depth. The synthetic RGB images have the same resolution and field of view as the corresponding depth images (512 × 512).
-
2D bounding boxes. Each 2D box in the synthetic dataset is represented by its class ID, the top-left and the bottom-right corners.
-
Pixel segmentation masks. For synthetic images the authors provide a single mask.
Summary #
TiCaM Synthectic Images: A Time-of-Flight In-Car Cabin Monitoring Dataset is a dataset for instance segmentation, semantic segmentation, object detection, and monocular depth estimation tasks. It is used in the safety and automotive industries.
The dataset consists of 9918 images with 64191 labeled objects belonging to 6 different classes including person, infant seat, child seat, and other: infant, child, and everyday object.
Images in the TiCaM: Synthetic Images dataset have pixel-level instance segmentation annotations. All images are labeled (i.e. with annotations). There is 1 split in the dataset: train (9918 images). Additionally, images are grouped by im id. Also every image contains information about its left seat, right seat. Images labels have position tag. Explore it in supervisely labeling tool. The dataset was released in 2021 by the Germany Research Center for Artificial Intelligence.

Explore #
TiCaM: Synthetic Images dataset has 9918 images. Click on one of the examples below or open "Explore" tool anytime you need to view dataset images with annotations. This tool has extended visualization capabilities like zoom, translation, objects table, custom filters and more. Hover the mouse over the images to hide or show annotations.











Class balance #
There are 6 annotation classes in the dataset. Find the general statistics and balances for every class in the table below. Click any row to preview images that have labels of the selected class. Sort by column to find the most rare or prevalent classes.
Class ㅤ | Images ㅤ | Objects ㅤ | Count on image average | Area on image average |
|---|---|---|---|---|
person➔ any | 9918 | 44547 | 4.49 | 29.55% |
infant seat➔ any | 2634 | 5466 | 2.08 | 5.47% |
child seat➔ any | 2481 | 6228 | 2.51 | 6.15% |
infant➔ any | 1317 | 3519 | 2.67 | 1.29% |
child➔ any | 1140 | 2397 | 2.1 | 3.08% |
everyday object➔ any | 1014 | 2034 | 2.01 | 1.64% |
Co-occurrence matrix #
Co-occurrence matrix is an extremely valuable tool that shows you the images for every pair of classes: how many images have objects of both classes at the same time. If you click any cell, you will see those images. We added the tooltip with an explanation for every cell for your convenience, just hover the mouse over a cell to preview the description.
Images #
Explore every single image in the dataset with respect to the number of annotations of each class it has. Click a row to preview selected image. Sort by any column to find anomalies and edge cases. Use horizontal scroll if the table has many columns for a large number of classes in the dataset.
Object distribution #
Interactive heatmap chart for every class with object distribution shows how many images are in the dataset with a certain number of objects of a specific class. Users can click cell and see the list of all corresponding images.
Class sizes #
The table below gives various size properties of objects for every class. Click a row to see the image with annotations of the selected class. Sort columns to find classes with the smallest or largest objects or understand the size differences between classes.
Class | Object count | Avg area | Max area | Min area | Min height | Min height | Max height | Max height | Avg height | Avg height | Min width | Min width | Max width | Max width |
|---|---|---|---|---|---|---|---|---|---|---|---|---|---|---|
person any | 44547 | 8.23% | 40.49% | 0.01% | 4px | 0.78% | 289px | 56.45% | 160px | 31.19% | 4px | 0.78% | 399px | 77.93% |
child seat any | 6228 | 3.95% | 7.2% | 0.01% | 4px | 0.78% | 160px | 31.25% | 124px | 24.2% | 3px | 0.59% | 118px | 23.05% |
infant seat any | 5466 | 4.15% | 5.75% | 0.01% | 6px | 1.17% | 117px | 22.85% | 104px | 20.34% | 5px | 0.98% | 153px | 29.88% |
infant any | 3519 | 0.67% | 1.7% | 0.01% | 8px | 1.56% | 74px | 14.45% | 45px | 8.77% | 7px | 1.37% | 66px | 12.89% |
child any | 2397 | 2.08% | 3.87% | 0.02% | 8px | 1.56% | 113px | 22.07% | 90px | 17.64% | 10px | 1.95% | 115px | 22.46% |
everyday object any | 2034 | 1.34% | 3.02% | 0.01% | 3px | 0.59% | 96px | 18.75% | 60px | 11.64% | 5px | 0.98% | 87px | 16.99% |
Spatial Heatmap #
The heatmaps below give the spatial distributions of all objects for every class. These visualizations provide insights into the most probable and rare object locations on the image. It helps analyze objects' placements in a dataset.

Objects #
Table contains all 64191 objects. Click a row to preview an image with annotations, and use search or pagination to navigate. Sort columns to find outliers in the dataset.
Object ID ㅤ | Class ㅤ | Image name click row to open | Image size height x width | Height ㅤ | Height ㅤ | Width ㅤ | Width ㅤ | Area ㅤ |
|---|---|---|---|---|---|---|---|---|
1➔ | everyday object any | aclass_20200923183122_train_imageID_647_GT_4_0_3.png | 512 x 512 | 13px | 2.54% | 19px | 3.71% | 0.08% |
2➔ | person any | aclass_20200923183122_train_imageID_647_GT_4_0_3.png | 512 x 512 | 275px | 53.71% | 258px | 50.39% | 5.97% |
3➔ | everyday object any | aclass_20200923183122_train_imageID_647_GT_4_0_3.png | 512 x 512 | 13px | 2.54% | 19px | 3.71% | 0.09% |
4➔ | person any | aclass_20200923183122_train_imageID_647_GT_4_0_3.png | 512 x 512 | 275px | 53.71% | 258px | 50.39% | 27.07% |
5➔ | person any | depth_aclass_20200924115200_train_imageID_165_GT_3_0_3.png | 512 x 512 | 236px | 46.09% | 139px | 27.15% | 5.54% |
6➔ | person any | depth_aclass_20200924115200_train_imageID_165_GT_3_0_3.png | 512 x 512 | 279px | 54.49% | 160px | 31.25% | 5.23% |
7➔ | person any | depth_aclass_20200924115200_train_imageID_165_GT_3_0_3.png | 512 x 512 | 8px | 1.56% | 22px | 4.3% | 0.03% |
8➔ | person any | depth_aclass_20200924115200_train_imageID_165_GT_3_0_3.png | 512 x 512 | 41px | 8.01% | 20px | 3.91% | 0.13% |
9➔ | person any | depth_aclass_20200924115200_train_imageID_165_GT_3_0_3.png | 512 x 512 | 236px | 46.09% | 139px | 27.15% | 12.51% |
10➔ | person any | depth_aclass_20200924115200_train_imageID_165_GT_3_0_3.png | 512 x 512 | 279px | 54.49% | 239px | 46.68% | 25.44% |
License #
License is unknown for the TICaM Synthetic: A Time-of-flight In-car Cabin Monitoring Dataset dataset.
Citation #
If you make use of the TiCaM Synthetic data, please cite the following reference:
@inproceedings{katrolia2021ticam,
  author    = {Jigyasa Singh Katrolia and
               Ahmed El{-}Sherif and
               Hartmut Feld and
               Bruno Mirbach and
               Jason R. Rambach and
               Didier Stricker},
  title     = {TICaM: {A} Time-of-flight In-car Cabin Monitoring Dataset},
  booktitle = {32nd British Machine Vision Conference 2021, {BMVC} 2021, Online,
               November 22-25, 2021},
  pages     = {277},
  publisher = {{BMVA} Press},
  year      = {2021},
  url       = {https://www.bmvc2021-virtualconference.com/assets/papers/0701.pdf},
  timestamp = {Wed, 22 Jun 2022 16:52:45 +0200},
  biburl    = {https://dblp.org/rec/conf/bmvc/KatroliaEFMRS21.bib},
  bibsource = {dblp computer science bibliography, https://dblp.org}
}
If you are happy with Dataset Ninja and use provided visualizations and tools in your work, please cite us:
@misc{ visualization-tools-for-ticam-synthetic-images-dataset,
  title = { Visualization Tools for TiCaM: Synthetic Images Dataset },
  type = { Computer Vision Tools },
  author = { Dataset Ninja },
  howpublished = { \url{ https://datasetninja.com/ticam-synthetic-images } },
  url = { https://datasetninja.com/ticam-synthetic-images },
  journal = { Dataset Ninja },
  publisher = { Dataset Ninja },
  year = { 2026 },
  month = { feb },
  note = { visited on 2026-02-22 },
}
Download #
Please visit dataset homepage to download the data.
Disclaimer #
Our gal from the legal dep told us we need to post this:
Dataset Ninja provides visualizations and statistics for some datasets that can be found online and can be downloaded by general audience. Dataset Ninja is not a dataset hosting platform and can only be used for informational purposes. The platform does not claim any rights for the original content, including images, videos, annotations and descriptions. Joint publishing is prohibited.
You take full responsibility when you use datasets presented at Dataset Ninja, as well as other information, including visualizations and statistics we provide. You are in charge of compliance with any dataset license and all other permissions. You are required to navigate datasets homepage and make sure that you can use it. In case of any questions, get in touch with us at hello@datasetninja.com.


