Introduction #
In the realm of tree species detection and classification from remote sensing data, the authors of the Tree Species Detection dataset highlight the domination of multispectral and hyperspectral images, along with Light Detection And Ranging (LiDAR) data. Notably, despite the availability of Red-Green-Blue (RGB) sensors, only a limited number of studies have delved into the utilization of RGB sensor-captured images. Furthermore, the emergence of deep learning techniques for object detection in recent years has introduced significant advancements. In light of these developments, the authors proposed and assessed the application of Convolutional Neural Network (CNN)-based methods, in conjunction with high spatial resolution RGB imagery obtained from Unmanned Aerial Vehicles (UAVs), for the purpose of detecting tree species under legal protection.
The preservation of sensitive tree species necessitates timely and precise information regarding their distribution in endangered areas. Remote sensing techniques have gained traction as alternatives to labor-intensive and costly field surveys for assessing forest resources. These techniques encompass the use of satellites, aerial surveys, and, more recently, Unmanned Aerial Vehicles (UAVs) as the primary platforms for data collection.
To the best of the authors’ knowledge, no prior research has centered on the application of state-of-the-art deep learning-based methodologies for tree detection using images acquired from RGB cameras mounted on UAVs. The authors aim to bridge this gap and offer an evaluation of deep learning-based approaches for the individual detection of trees in high-resolution UAV RGB imagery. Their study specifically concentrates on the tree species Dipteryx alata Vogel (Fabaceae), commonly referred to as “baru” or cumbaru. This species faces a significant risk of extinction, as indicated by the IUCN (2019) (The International Union for Conservation of Nature’s Red List of Threatened Species). Cumbaru trees hold substantial economic potential and find diverse applications, primarily in the realm of non-timber forest products. They exhibit a wide distribution, predominantly within the Brazilian Savanna, although occurrences have been noted in the wetlands of Midwest Brazil.
The experimental process unfolded in four primary phases. Firstly, RGB images were acquired at various points throughout the year using a UAV-based camera. A specialist was tasked with annotating these images by delineating cumbaru trees using bounding boxes. Subsequently, the networks associated with each method were trained to detect instances of cumbaru trees within a designated set of training images. In the third step, the trained networks were applied to images not included in the training dataset, with the objective of predicting the presence of cumbaru trees and producing corresponding bounding boxes. The final phase involved the computation of accuracy metrics for each method based on the predicted outcomes.
| Aircraft | Sensor | Field of View | Nominal Focal Length | Image Size | Mean GSD | Mean Flight Height |
|---|---|---|---|---|---|---|
| Phantom4 | 1” CMOS | 84° | 8.8 mm | 5472 × 3648 | 0.82 cm | 30 m |
| Advanced | (20 Mp) |
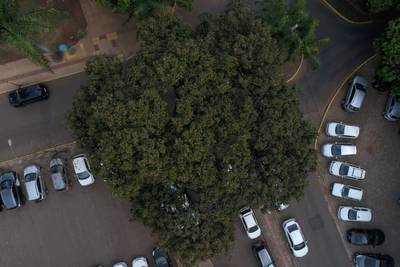
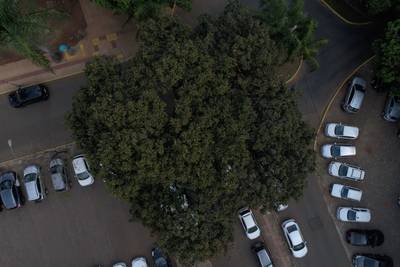
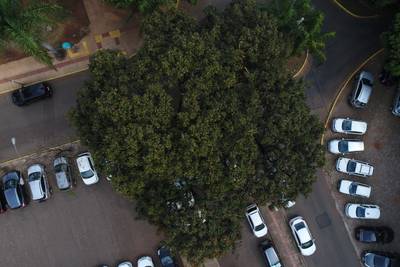
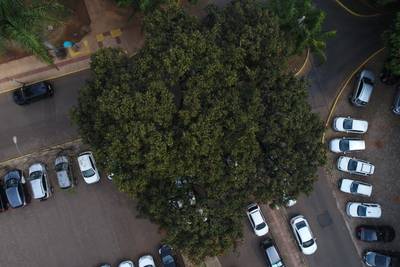
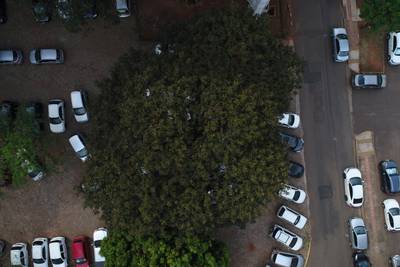
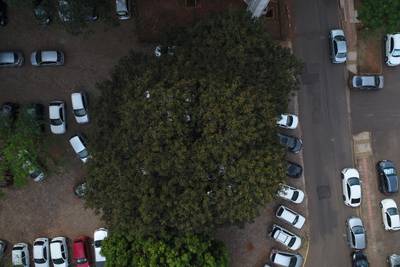
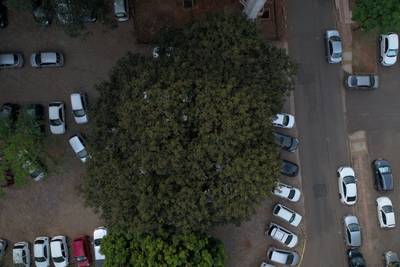
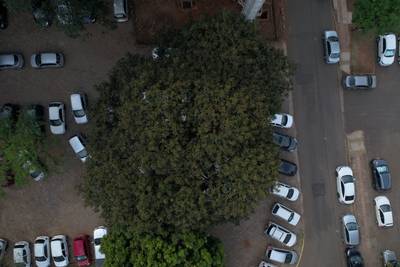
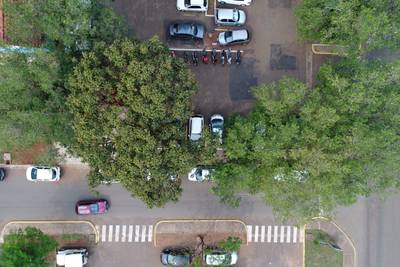
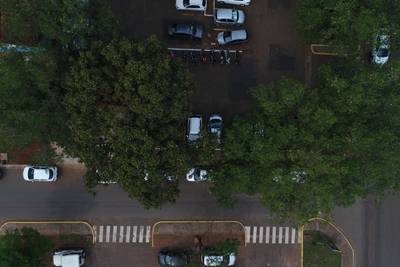
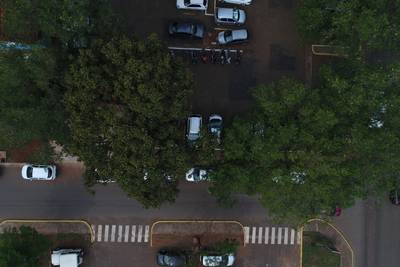
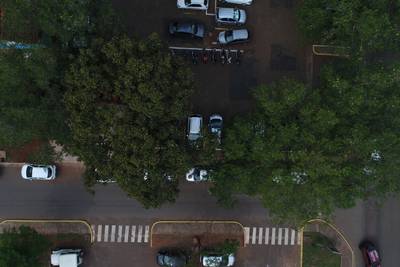
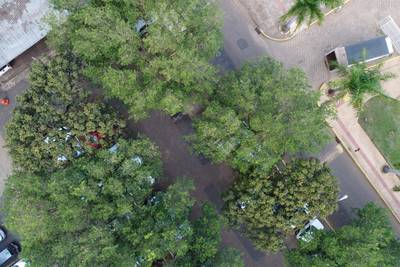
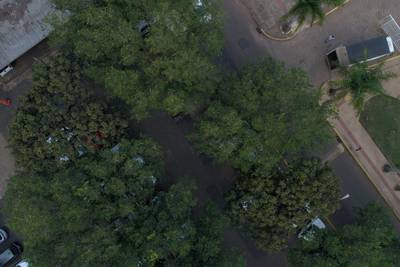
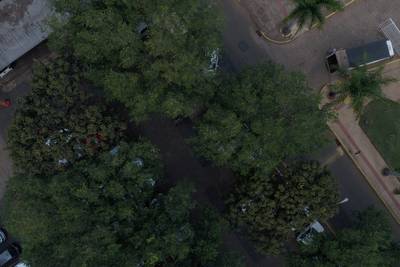
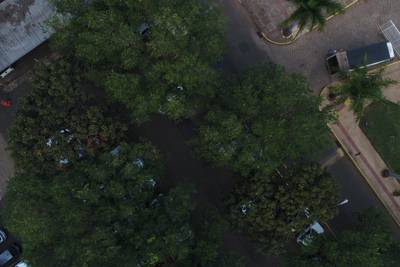
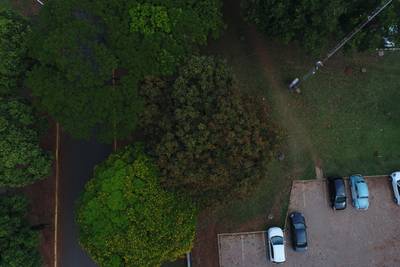
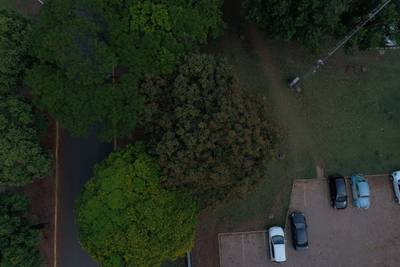
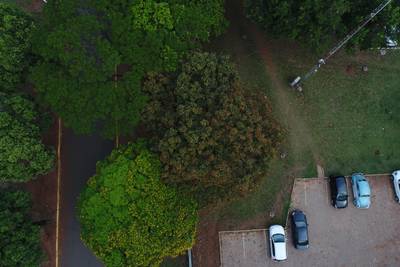
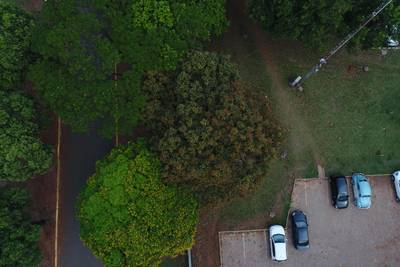
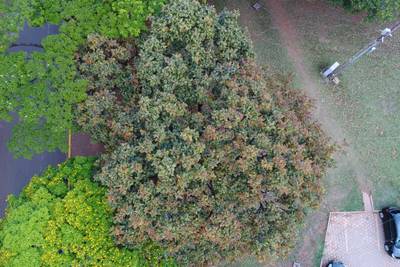
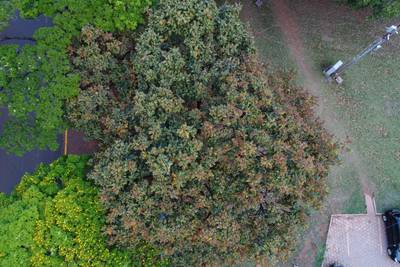
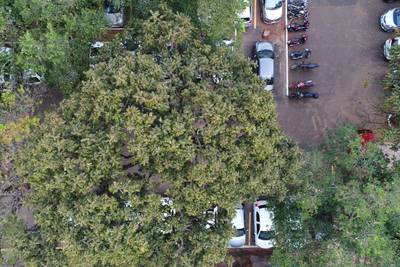
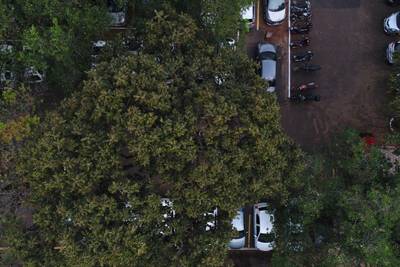
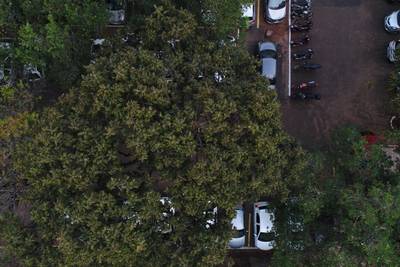
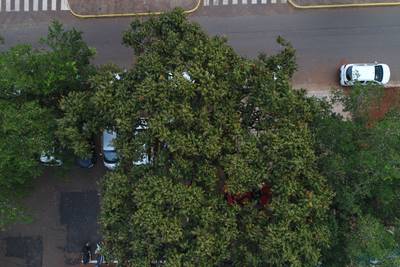
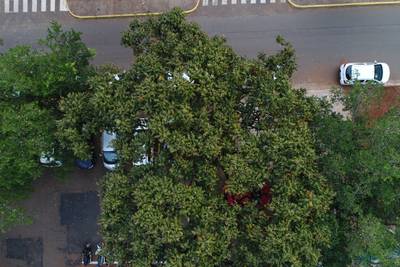
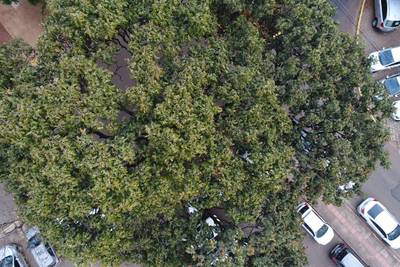
A total of 392 UAV images (Please note, that DatasetNinja holds an updated version of the dataset with 712 images) were procured over a seven-month period, spanning from August 2018 to February 2019, across six missions. The advanced Phantom 4 UAV, equipped with a 20-megapixel camera, captured these images at flight altitudes ranging from 20 to 40 meters (refer to Table 1 for comprehensive details). These images exhibited a mean Ground Sample Distance (GSD) of 0.82 cm (centimeters) and were acquired within three distinct study regions, encompassing a total area of approximately 150,000.00 square meters, situated in the urban domain of Campo Grande municipality, Mato Grosso do Sul, Brazil. These missions collectively encompassed around 110 trees, each captured with variations in appearance, scale, and illumination:
Examples from the dataset: images captured on: (a) 26 August 2018; (b) 21 September 2018; ( c) 22 September 2018; and (d) 20 February 2019
Each image within the dataset underwent meticulous annotation by a specialist employing LabelMe software. During this annotation process, a bounding box delineated by the top-left and bottom-right corners was assigned to each cumbaru tree specimen present in the image.
Summary #
Tree Species Detection is a dataset for an object detection task. It is used in the environmental domain.
The dataset consists of 712 images with 715 labeled objects belonging to 1 single class (cumbaru).
Images in the Tree Species Detection dataset have bounding box annotations. All images are labeled (i.e. with annotations). There are 3 splits in the dataset: test (314 images), train (295 images), and val (103 images). The dataset was released in 2019 by the BR-GER joint research group.

Explore #
Tree Species Detection dataset has 712 images. Click on one of the examples below or open "Explore" tool anytime you need to view dataset images with annotations. This tool has extended visualization capabilities like zoom, translation, objects table, custom filters and more. Hover the mouse over the images to hide or show annotations.






























Class balance #
There are 1 annotation classes in the dataset. Find the general statistics and balances for every class in the table below. Click any row to preview images that have labels of the selected class. Sort by column to find the most rare or prevalent classes.
Class ㅤ | Images ㅤ | Objects ㅤ | Count on image average | Area on image average |
|---|---|---|---|---|
cumbaru➔ rectangle | 712 | 715 | 1 | 29.02% |
Images #
Explore every single image in the dataset with respect to the number of annotations of each class it has. Click a row to preview selected image. Sort by any column to find anomalies and edge cases. Use horizontal scroll if the table has many columns for a large number of classes in the dataset.
Object distribution #
Interactive heatmap chart for every class with object distribution shows how many images are in the dataset with a certain number of objects of a specific class. Users can click cell and see the list of all corresponding images.
Class sizes #
The table below gives various size properties of objects for every class. Click a row to see the image with annotations of the selected class. Sort columns to find classes with the smallest or largest objects or understand the size differences between classes.
Class | Object count | Avg area | Max area | Min area | Min height | Min height | Max height | Max height | Avg height | Avg height | Min width | Min width | Max width | Max width |
|---|---|---|---|---|---|---|---|---|---|---|---|---|---|---|
cumbaru rectangle | 715 | 28.9% | 92.46% | 1.16% | 472px | 15.33% | 3617px | 99.15% | 2162px | 60.73% | 415px | 7.58% | 5333px | 97.46% |
Spatial Heatmap #
The heatmaps below give the spatial distributions of all objects for every class. These visualizations provide insights into the most probable and rare object locations on the image. It helps analyze objects' placements in a dataset.

Objects #
Table contains all 715 objects. Click a row to preview an image with annotations, and use search or pagination to navigate. Sort columns to find outliers in the dataset.
Object ID ㅤ | Class ㅤ | Image name click row to open | Image size height x width | Height ㅤ | Height ㅤ | Width ㅤ | Width ㅤ | Area ㅤ |
|---|---|---|---|---|---|---|---|---|
1➔ | cumbaru rectangle | 13_09_18_DJI_0041.JPG | 3648 x 5472 | 2730px | 74.84% | 2730px | 49.89% | 37.34% |
2➔ | cumbaru rectangle | 22_09_18_DJI_0241.JPG | 3648 x 5472 | 2613px | 71.63% | 3033px | 55.43% | 39.7% |
3➔ | cumbaru rectangle | 22_09_18_DJI_0249.JPG | 3648 x 5472 | 1633px | 44.76% | 2901px | 53.02% | 23.73% |
4➔ | cumbaru rectangle | 22_09_18_DJI_0156.JPG | 3648 x 5472 | 3469px | 95.09% | 2697px | 49.29% | 46.87% |
5➔ | cumbaru rectangle | 13_09_18_DJI_0029.JPG | 3648 x 5472 | 1348px | 36.95% | 1348px | 24.63% | 9.1% |
6➔ | cumbaru rectangle | 22_09_18_DJI_0220.JPG | 3648 x 5472 | 2437px | 66.8% | 4073px | 74.43% | 49.72% |
7➔ | cumbaru rectangle | 22_09_18_DJI_0101.JPG | 3648 x 5472 | 3353px | 91.91% | 3333px | 60.91% | 55.98% |
8➔ | cumbaru rectangle | 18_08_18_DJI_0003.JPG | 3648 x 5472 | 1390px | 38.1% | 2076px | 37.94% | 14.46% |
9➔ | cumbaru rectangle | 22_09_18_DJI_0387.JPG | 3648 x 5472 | 913px | 25.03% | 1325px | 24.21% | 6.06% |
10➔ | cumbaru rectangle | 22_09_18_DJI_0193.JPG | 3648 x 5472 | 1749px | 47.94% | 3373px | 61.64% | 29.55% |
License #
Citation #
If you make use of the Tree Species Detection data, please cite the following reference:
@Article{s19163595,
  AUTHOR = {Santos, Anderson Aparecido dos and Marcato Junior, José and Araújo, Márcio Santos and Di Martini, David Robledo and Tetila, Everton Castelão and Siqueira, Henrique Lopes and Aoki, Camila and Eltner, Anette and Matsubara, Edson Takashi and Pistori, Hemerson and Feitosa, Raul Queiroz and Liesenberg, Veraldo and Gonçalves, Wesley Nunes},
  TITLE = {Assessment of CNN-Based Methods for Individual Tree Detection on Images Captured by RGB Cameras Attached to UAVs},
  JOURNAL = {Sensors},
  VOLUME = {19},
  YEAR = {2019},
  NUMBER = {16},
  ARTICLE-NUMBER = {3595},
  URL = {https://www.mdpi.com/1424-8220/19/16/3595},
  PubMedID = {31426597},
  ISSN = {1424-8220},
  ABSTRACT = {Detection and classification of tree species from remote sensing data were performed using mainly multispectral and hyperspectral images and Light Detection And Ranging (LiDAR) data. Despite the comparatively lower cost and higher spatial resolution, few studies focused on images captured by Red-Green-Blue (RGB) sensors. Besides, the recent years have witnessed an impressive progress of deep learning methods for object detection. Motivated by this scenario, we proposed and evaluated the usage of Convolutional Neural Network (CNN)-based methods combined with Unmanned Aerial Vehicle (UAV) high spatial resolution RGB imagery for the detection of law protected tree species. Three state-of-the-art object detection methods were evaluated: Faster Region-based Convolutional Neural Network (Faster R-CNN), YOLOv3 and RetinaNet. A dataset was built to assess the selected methods, comprising 392 RBG images captured from August 2018 to February 2019, over a forested urban area in midwest Brazil. The target object is an important tree species threatened by extinction known as Dipteryx alata Vogel (Fabaceae). The experimental analysis delivered average precision around 92% with an associated processing times below 30 miliseconds.},
DOI = {10.3390/s19163595}
}
If you are happy with Dataset Ninja and use provided visualizations and tools in your work, please cite us:
@misc{ visualization-tools-for-tree-species-detection-dataset,
  title = { Visualization Tools for Tree Species Detection Dataset },
  type = { Computer Vision Tools },
  author = { Dataset Ninja },
  howpublished = { \url{ https://datasetninja.com/tree-species-detection } },
  url = { https://datasetninja.com/tree-species-detection },
  journal = { Dataset Ninja },
  publisher = { Dataset Ninja },
  year = { 2026 },
  month = { feb },
  note = { visited on 2026-02-22 },
}
Download #
Dataset Tree Species Detection can be downloaded in Supervisely format:
As an alternative, it can be downloaded with dataset-tools package:
pip install --upgrade dataset-tools
… using following python code:
import dataset_tools as dtools

dtools.download(dataset='Tree Species Detection', dst_dir='~/dataset-ninja/')
Make sure not to overlook the python code example available on the Supervisely Developer Portal. It will give you a clear idea of how to effortlessly work with the downloaded dataset.
The data in original format can be downloaded here.
Disclaimer #
Our gal from the legal dep told us we need to post this:
Dataset Ninja provides visualizations and statistics for some datasets that can be found online and can be downloaded by general audience. Dataset Ninja is not a dataset hosting platform and can only be used for informational purposes. The platform does not claim any rights for the original content, including images, videos, annotations and descriptions. Joint publishing is prohibited.
You take full responsibility when you use datasets presented at Dataset Ninja, as well as other information, including visualizations and statistics we provide. You are in charge of compliance with any dataset license and all other permissions. You are required to navigate datasets homepage and make sure that you can use it. In case of any questions, get in touch with us at hello@datasetninja.com.


