Introduction #
The authors compiled a novel dataset named VOST: Video Object Segmentation under Transformations Dataset, comprising over 700 high-resolution videos. These videos, averaging 21 seconds in length, were recorded in varied environments and meticulously labeled with instance masks. Employing a meticulous, multi-step methodology, the authors ensured that the videos primarily spotlighted intricate object transformations, spanning their entire temporal evolution. Subsequently, they conducted thorough evaluations of leading VOS methods, leading to several significant findings.
Motivation
Spatial and temporal cues play a pivotal role in segmenting and tracking objects in human perception, where the static visual appearance serves a secondary role. In extreme cases, objects can be localized and tracked solely based on their coherent motion, devoid of any distinct appearance. This emphasis on motion-based tracking not only enhances resilience against sensory noise but also facilitates reasoning about object permanence. In contrast, contemporary computer vision models for video object segmentation predominantly operate under an appearance-first framework. These models effectively store image patches alongside their corresponding instance labels and retrieve similar patches to segment the target frame. What accounts for this noticeable contrast? While some factors are algorithmic, such as the initial development of object recognition models for static images, a significant reason lies in the datasets utilized. For instance, consider the “Breakdance” sequence from the validation set of DAVIS’17. Despite significant deformations and pose variations in the dancer’s body, the overall visual appearance remains consistent, serving as a potent cue for segmentation tasks.
Video frames from the DAVIS’17 dataset (above), and the authors proposed VOST (below). While existing VOS datasets feature many challenges, such as deformations and pose change, the overall appearance of objects varies little. The authors work focuses on object transformations, where appearance is no longer a reliable cue and more advanced spatio temporal modeling is required.
However, this example, which is emblematic of numerous Video Object Segmentation (VOS) datasets, merely scratches the surface of an object’s lifecycle. Beyond mere translations, rotations, and minor deformations, objects undergo transformative processes. Bananas may be peeled, paper can be cut, and clay can be molded into bricks, among other transformations. These changes can profoundly alter an object’s color, texture, and shape, often retaining nothing of the original except for its underlying identity. While humans, such as labelers, can relatively easily track object identity through these transformations, it poses a formidable challenge for VOS models.
Dataset creation
The authors opted to acquire their videos from recent, extensive egocentric action recognition datasets, which offer temporal annotations for a wide range of activities. Specifically, they utilized datasets such as EPIC-KITCHENS and Ego4D. The former captures activities predominantly in kitchen settings, such as cooking or cleaning, while the latter presents a broader array of scenarios, encompassing outdoor environments as well. It’s important to highlight that the egocentric focus of VOST stems solely from the datasets chosen for video sourcing. The inherent nature of the problem transcends the camera viewpoint, and they anticipate that methodologies developed within VOST will extend seamlessly to third-person video contexts. Although these datasets contain tens of thousands of clips, the majority of actions captured (such as ‘take’ or ‘look’) do not involve object transformations. To efficiently sift out these irrelevant clips, the authors leverage the concept of change of state verbs derived from language theory. Instead of manually sorting through the videos directly, they initially filter the action labels. This approach significantly diminishes the total number of clips under consideration, narrowing it down to 10,706 (3,824 from EPIC-KITCHENS and 6,882 from Ego4D).
While all the previously selected clips exhibit some form of object state change, not all lead to noticeable alterations in appearance. For instance, actions like folding a towel in half or shaking a paintbrush have minimal impact on their overall appearance. To zero in on the more intricate scenarios, the authors manually evaluate each video and assign it a complexity rating on a scale ranging from 1 to 5. A rating of 1 indicates negligible visible object transformation, while a rating of 5 signifies a substantial change in appearance, shape, and texture. Additionally, the authors consolidate clips depicting multiple steps of the same transformation (e.g., successive onion cuts) at this stage. After collecting these complexity labels, it becomes evident that the majority of videos encountered in real-world settings are not particularly challenging. Nevertheless, the authors are left with 986 clips falling within the 4-5 complexity range, capturing the entirety of these intricate transformations. Further refinement of the dataset involves two key criteria. Firstly, some videos prove exceptionally challenging to label accurately with dense instance masks, often due to excessive motion blur, prompting their exclusion. Secondly, a few substantial clusters of nearly identical clips emerge (e.g., 116 instances of molding clay into bricks performed by the same actor in identical environments), leading to a sub-sampling process to mitigate bias. The resulting dataset comprises 713 videos showcasing 51 distinct transformations across 155 object categories.
| Score | Definition |
|---|---|
| 1 | No visible object transformation. Either the verb was used in a different context or there was a mistake in the original annotation. |
| 2 | Technically there is a transformation in a video, but it only results in a negligible change of appearance and/or shape (e.g. folding a white towel in half or shaking a paint brush). |
| 3 | A noticeable transformation that nevertheless preserves the overall appearance and shape of the object (e.g. cutting an onion in half or opening the hood of a car). |
| 4 | A transformation that results in a significant change of the object shape and appearance (e.g. peeling a banana or breaking glass). |
| 5 | Complete change of object appearance, shape and texture (e.g breaking of an egg or grinding beans into flour). |
Definition of complexity scores used when filtering videos for VOST. These are by no means general, but they were helpful to formalize the process of video selection when constructing the dataset.
Initially, the authors note that while there is a tendency towards more frequent actions like cutting, the dataset exhibits a significant diversity of interactions, extending into the long tail of less common actions. Furthermore, as depicted by the correlation statistics on the right side of the figure, the action of cutting encompasses a remarkably wide semantic range, applicable to virtually any object, leading to diverse transformations. In essence, the correlation statistics underscore the dataset’s substantial entropy, highlighting its rich diversity.
Annotation collection
To label the selected videos, the authors initially adjust the temporal boundaries of each clip to encompass the entire duration of the transformation, except for exceedingly long sequences lasting a minute or more. To strike a balance between annotation costs and temporal resolution, they opt to label videos at 5 frames per second (fps). A crucial consideration arises regarding how to annotate objects as they undergo division (e.g., due to cutting or breaking). To mitigate ambiguity, the authors adopt a straightforward and overarching principle: if a region is identified as an object in the initial frame of a video, all subsequent parts originating from it retain the same identity. For instance, the yolks resulting from broken eggs maintain the identity of the parent object. This approach not only ensures clarity in the data but also provides an unambiguous signal—spatio-temporal continuity—that algorithms can leverage for generalization.
Representative samples from VOST with annotations at three different time steps (see video for full results). Colours indicate instance ids, with grey representing ignored regions. VOST captures a wide variety of transformations in diverse environments and provides pixel-perfect labels even for the most challenging sequences.
However, there are instances where providing an accurate instance mask for a region proves challenging. In one scenario, a piece of clay exhibits rapid motion, rendering the establishment of a clear boundary impossible. In another example, egg whites from multiple eggs are mixed together, making it difficult to distinguish them from each other. Instead of omitting such videos, the authors opt to label the ambiguous regions with precise “Ignore” segments, which are excluded from both training and evaluation processes. This adaptable approach ensures consistent annotation, even in the face of the most daunting videos. Given the intricate nature of the task, the authors employed a dedicated team of 20 professional annotators for the entire project duration. These annotators underwent extensive training, including instruction on handling edge cases, over a 4 week period to ensure uniformity in their approach. Each video was labeled by a single annotator using the Amazon SageMaker GroundTruth tool for polygon labeling. Subsequently, a small, held-out group of skilled annotators reviewed the labeled videos and provided feedback for corrections, a process that continued until no further issues were identified. On average, each video underwent 3.9 rounds of annotation review to ensure the highest label quality. In total, 175,913 masks were collected, with an average track duration of 21.3 seconds.
Interface of the annotation tool.
Dataset split
The VOST dataset comprises 572 training videos, 70 validation videos, and 71 test videos. While the labels for the training and validation sets have been made publicly available, the test set is kept separate and accessible only through an evaluation server to prevent overfitting. Additionally, the authors maintain strict separation among the three sets by ensuring that each kitchen and each subject appears in only one of the training, validation, or test sets. This measure guarantees that the data distribution across the sets remains well-separated and avoids any data leakage between them.
Note: the authors did not provide images for the test dataset.
Summary #
VOST: Video Object Segmentation under Transformations Dataset is a dataset for instance segmentation, semantic segmentation, object detection, and identification tasks. It is applicable or relevant across various domains. Also, it is used in the food industry.
The dataset consists of 67750 images with 473218 labeled objects belonging to 141 different classes including onion, dough, potato, and other: carrot, paint, garlic, peach, tomato, paper, bag, cheese, wood, courgette, cards, clay, cloth, broccoli, olive, cucumber, film, pepper, gourd, food, banana, iron, batter, container, meat, and 113 more.
Images in the VOST dataset have pixel-level semantic segmentation annotations. There are 514 (1% of the total) unlabeled images (i.e. without annotations). There are 2 splits in the dataset: train (59930 images) and val (7820 images). Additionally, every image marked with its action and sequence tags. The dataset was released in 2023 by the Toyota Research Institute, USA.
Here is a visualized example for randomly selected sample classes:
Explore #
VOST dataset has 67750 images. Click on one of the examples below or open "Explore" tool anytime you need to view dataset images with annotations. This tool has extended visualization capabilities like zoom, translation, objects table, custom filters and more. Hover the mouse over the images to hide or show annotations.































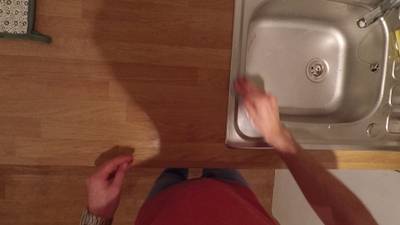























Class balance #
There are 141 annotation classes in the dataset. Find the general statistics and balances for every class in the table below. Click any row to preview images that have labels of the selected class. Sort by column to find the most rare or prevalent classes.
Class ㅤ | Images ㅤ | Objects ㅤ | Count on image average | Area on image average |
|---|---|---|---|---|
onion➔ mask | 5449 | 41624 | 7.64 | 1.23% |
dough➔ mask | 5146 | 43111 | 8.38 | 3.79% |
potato➔ mask | 3192 | 23550 | 7.38 | 1.01% |
carrot➔ mask | 2729 | 19294 | 7.07 | 0.91% |
paint➔ mask | 2648 | 12362 | 4.67 | 1.15% |
garlic➔ mask | 2613 | 18508 | 7.08 | 0.25% |
peach➔ mask | 1960 | 15909 | 8.12 | 1.18% |
tomato➔ mask | 1904 | 12989 | 6.82 | 0.82% |
paper➔ mask | 1697 | 7872 | 4.64 | 6.43% |
bag➔ mask | 1551 | 8022 | 5.17 | 8.42% |
Images #
Explore every single image in the dataset with respect to the number of annotations of each class it has. Click a row to preview selected image. Sort by any column to find anomalies and edge cases. Use horizontal scroll if the table has many columns for a large number of classes in the dataset.
Object distribution #
Interactive heatmap chart for every class with object distribution shows how many images are in the dataset with a certain number of objects of a specific class. Users can click cell and see the list of all corresponding images.
Class sizes #
The table below gives various size properties of objects for every class. Click a row to see the image with annotations of the selected class. Sort columns to find classes with the smallest or largest objects or understand the size differences between classes.
Class | Object count | Avg area | Max area | Min area | Min height | Min height | Max height | Max height | Avg height | Avg height | Min width | Min width | Max width | Max width |
|---|---|---|---|---|---|---|---|---|---|---|---|---|---|---|
dough mask | 43111 | 0.45% | 21.8% | 0% | 1px | 0.09% | 856px | 79.26% | 98px | 9.06% | 2px | 0.1% | 1331px | 69.65% |
onion mask | 41624 | 0.16% | 4.79% | 0% | 1px | 0.09% | 542px | 42.69% | 68px | 6.26% | 1px | 0.05% | 610px | 31.77% |
potato mask | 23550 | 0.14% | 3.08% | 0% | 1px | 0.09% | 340px | 31.48% | 66px | 6.12% | 1px | 0.05% | 524px | 27.29% |
carrot mask | 19294 | 0.13% | 2.53% | 0% | 1px | 0.09% | 631px | 58.43% | 76px | 6.89% | 1px | 0.05% | 521px | 27.14% |
garlic mask | 18508 | 0.04% | 1.94% | 0% | 2px | 0.19% | 377px | 34.91% | 36px | 3.21% | 2px | 0.1% | 329px | 17.14% |
peach mask | 15909 | 0.15% | 2.58% | 0% | 2px | 0.19% | 318px | 29.44% | 72px | 6.67% | 1px | 0.05% | 455px | 23.7% |
tomato mask | 12989 | 0.12% | 1.65% | 0% | 2px | 0.19% | 414px | 38.33% | 65px | 5.93% | 2px | 0.1% | 303px | 17.57% |
pepper mask | 12698 | 0.12% | 1.91% | 0% | 2px | 0.19% | 358px | 33.15% | 56px | 5.17% | 1px | 0.05% | 323px | 16.82% |
paint mask | 12362 | 0.25% | 16.77% | 0% | 1px | 0.09% | 955px | 88.43% | 65px | 5.7% | 1px | 0.05% | 726px | 43.19% |
gourd mask | 10734 | 0.1% | 1.77% | 0% | 3px | 0.28% | 459px | 42.5% | 64px | 5.91% | 3px | 0.21% | 299px | 20.76% |
Spatial Heatmap #
The heatmaps below give the spatial distributions of all objects for every class. These visualizations provide insights into the most probable and rare object locations on the image. It helps analyze objects' placements in a dataset.

Objects #
Table contains all 100110 objects. Click a row to preview an image with annotations, and use search or pagination to navigate. Sort columns to find outliers in the dataset.
Object ID ㅤ | Class ㅤ | Image name click row to open | Image size height x width | Height ㅤ | Height ㅤ | Width ㅤ | Width ㅤ | Area ㅤ |
|---|---|---|---|---|---|---|---|---|
1➔ | bag mask | 8253_open_bag_frame00390.jpg | 1080 x 1920 | 288px | 26.67% | 300px | 15.62% | 3.33% |
2➔ | bag mask | 8253_open_bag_frame00390.jpg | 1080 x 1920 | 221px | 20.46% | 255px | 13.28% | 1.78% |
3➔ | bag mask | 8253_open_bag_frame00390.jpg | 1080 x 1920 | 16px | 1.48% | 12px | 0.62% | 0.01% |
4➔ | bag mask | 8253_open_bag_frame00390.jpg | 1080 x 1920 | 16px | 1.48% | 11px | 0.57% | 0.01% |
5➔ | bag mask | 8253_open_bag_frame00390.jpg | 1080 x 1920 | 14px | 1.3% | 14px | 0.73% | 0.01% |
6➔ | bag mask | 8253_open_bag_frame00390.jpg | 1080 x 1920 | 13px | 1.2% | 13px | 0.68% | 0.01% |
7➔ | bag mask | 8253_open_bag_frame00390.jpg | 1080 x 1920 | 14px | 1.3% | 12px | 0.62% | 0.01% |
8➔ | bag mask | 8253_open_bag_frame00390.jpg | 1080 x 1920 | 15px | 1.39% | 14px | 0.73% | 0.01% |
9➔ | bag mask | 8253_open_bag_frame00390.jpg | 1080 x 1920 | 324px | 30% | 320px | 16.67% | 0.65% |
10➔ | bag mask | 8253_open_bag_frame00390.jpg | 1080 x 1920 | 9px | 0.83% | 8px | 0.42% | 0% |
License #
VOST: Video Object Segmentation under Transformations Dataset is under CC BY-NC-SA 4.0 license.
Citation #
If you make use of the VOST data, please cite the following reference:
@inproceedings{tokmakov2023breaking,
  title={Breaking the “Object” in Video Object Segmentation},
  author={Tokmakov, Pavel and Li, Jie and Gaidon, Adrien},
  booktitle={CVPR},
  year={2023}
}
If you are happy with Dataset Ninja and use provided visualizations and tools in your work, please cite us:
@misc{ visualization-tools-for-vost-dataset,
  title = { Visualization Tools for VOST Dataset },
  type = { Computer Vision Tools },
  author = { Dataset Ninja },
  howpublished = { \url{ https://datasetninja.com/vost } },
  url = { https://datasetninja.com/vost },
  journal = { Dataset Ninja },
  publisher = { Dataset Ninja },
  year = { 2026 },
  month = { feb },
  note = { visited on 2026-02-04 },
}
Download #
Dataset VOST can be downloaded in Supervisely format:
As an alternative, it can be downloaded with dataset-tools package:
pip install --upgrade dataset-tools
… using following python code:
import dataset_tools as dtools

dtools.download(dataset='VOST', dst_dir='~/dataset-ninja/')
Make sure not to overlook the python code example available on the Supervisely Developer Portal. It will give you a clear idea of how to effortlessly work with the downloaded dataset.
The data in original format can be downloaded here.
Disclaimer #
Our gal from the legal dep told us we need to post this:
Dataset Ninja provides visualizations and statistics for some datasets that can be found online and can be downloaded by general audience. Dataset Ninja is not a dataset hosting platform and can only be used for informational purposes. The platform does not claim any rights for the original content, including images, videos, annotations and descriptions. Joint publishing is prohibited.
You take full responsibility when you use datasets presented at Dataset Ninja, as well as other information, including visualizations and statistics we provide. You are in charge of compliance with any dataset license and all other permissions. You are required to navigate datasets homepage and make sure that you can use it. In case of any questions, get in touch with us at hello@datasetninja.com.


